Overview
The audit logs at the Global Level provide a comprehensive view of activities and changes at the global level, including creations, modifications, and deletions of settings and configurations. These logs track adjustments made to global settings, such as enabling or disabling regions, which impact resource creation and lab management. This article explains how to access and interpret global audit log information.
By the end of this article, you should be able to:
Access the global audit logs.
Understand and analyze the events and actions recorded in the logs.
Filter the logs to extract meaningful insights.
Steps to Access and View Global Audit Logs
Follow the below steps to Access and View Audit Logs
Log in to https://portal.cloudlabs.ai/
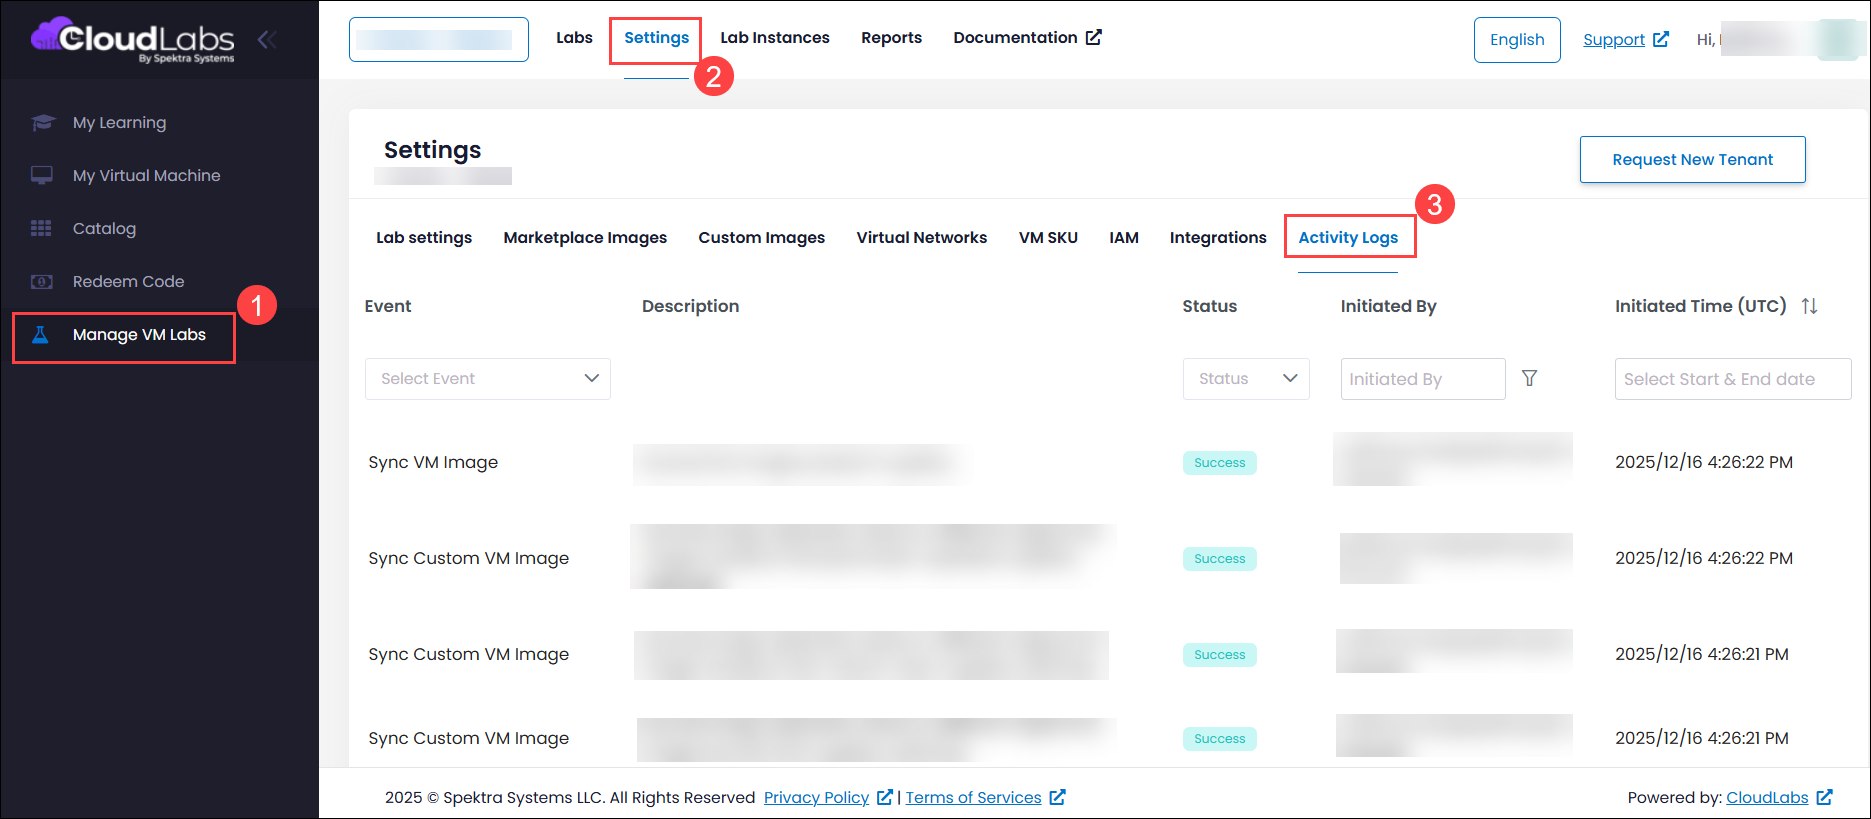
Navigate to Manage VM Labs (1) > Settings (2) > Activity Logs (3).
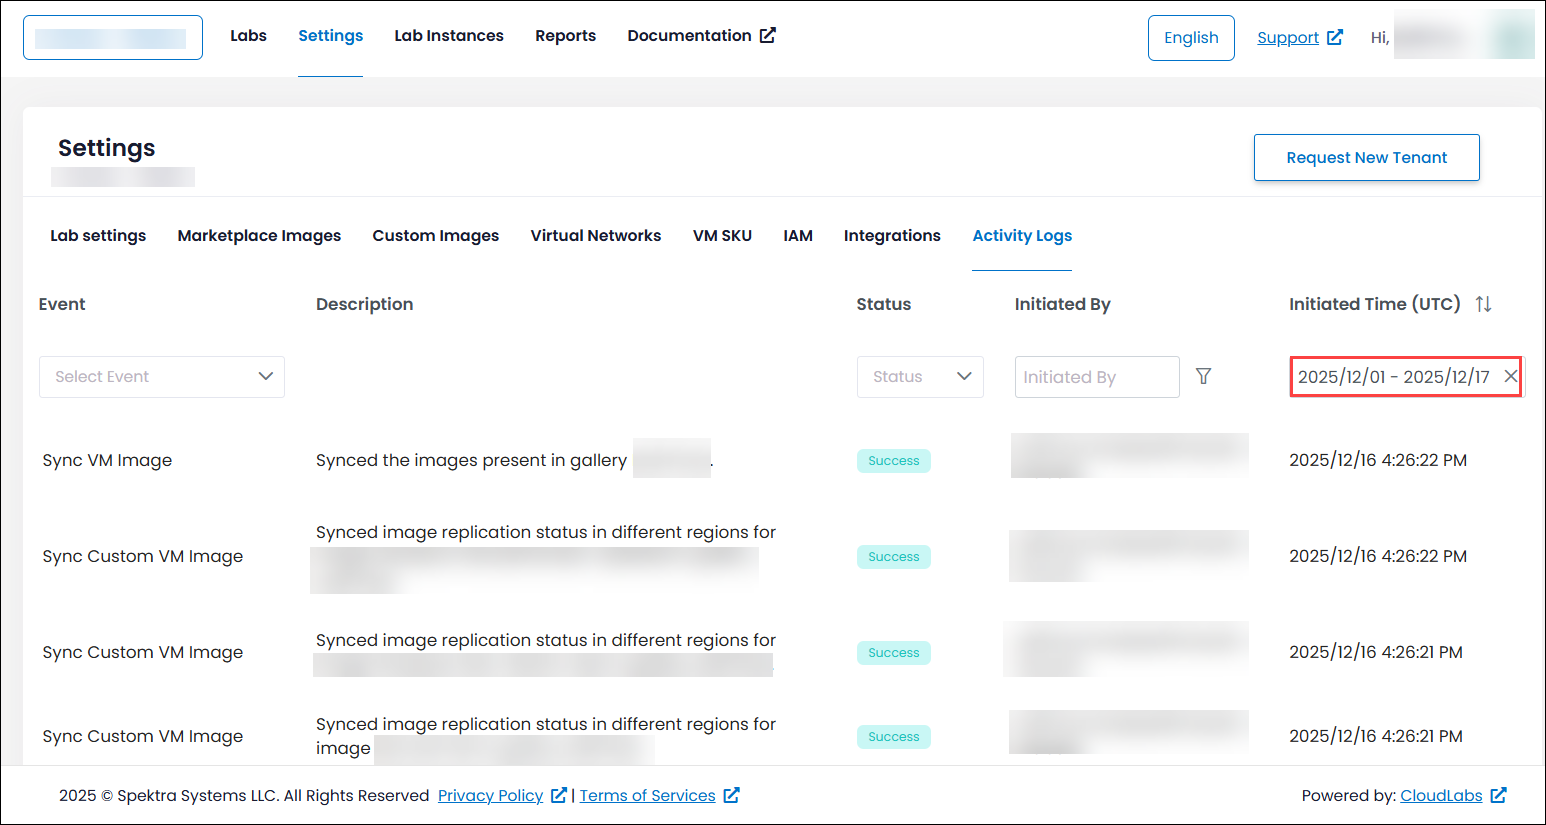
In the Activity Logs section, you will see a list of all global events that have occurred, including any changes related to global Lab settings, marketplace images, custom images, virtual networks, VM SKU, IAM, and integrations. Below is an outline of the key components covered under Activity Logs:
Event: Displays the type of event, such as "Create Compute Gallery" or "Sync Directory Groups."
Description: Provides a brief summary of the event.
Status: Shows whether the event was successful or failed.
Initiated By: Indicates who or what triggered the event (e.g., user email or automated process).
Initiated Time: The timestamp, including both date and time, indicating when the event occurred.
Filtering Events
To refine the audit logs based on specific criteria, use the filtering options available to narrow down the events. You can filter by event type, status, initiated by, and date range to focus on relevant entries.
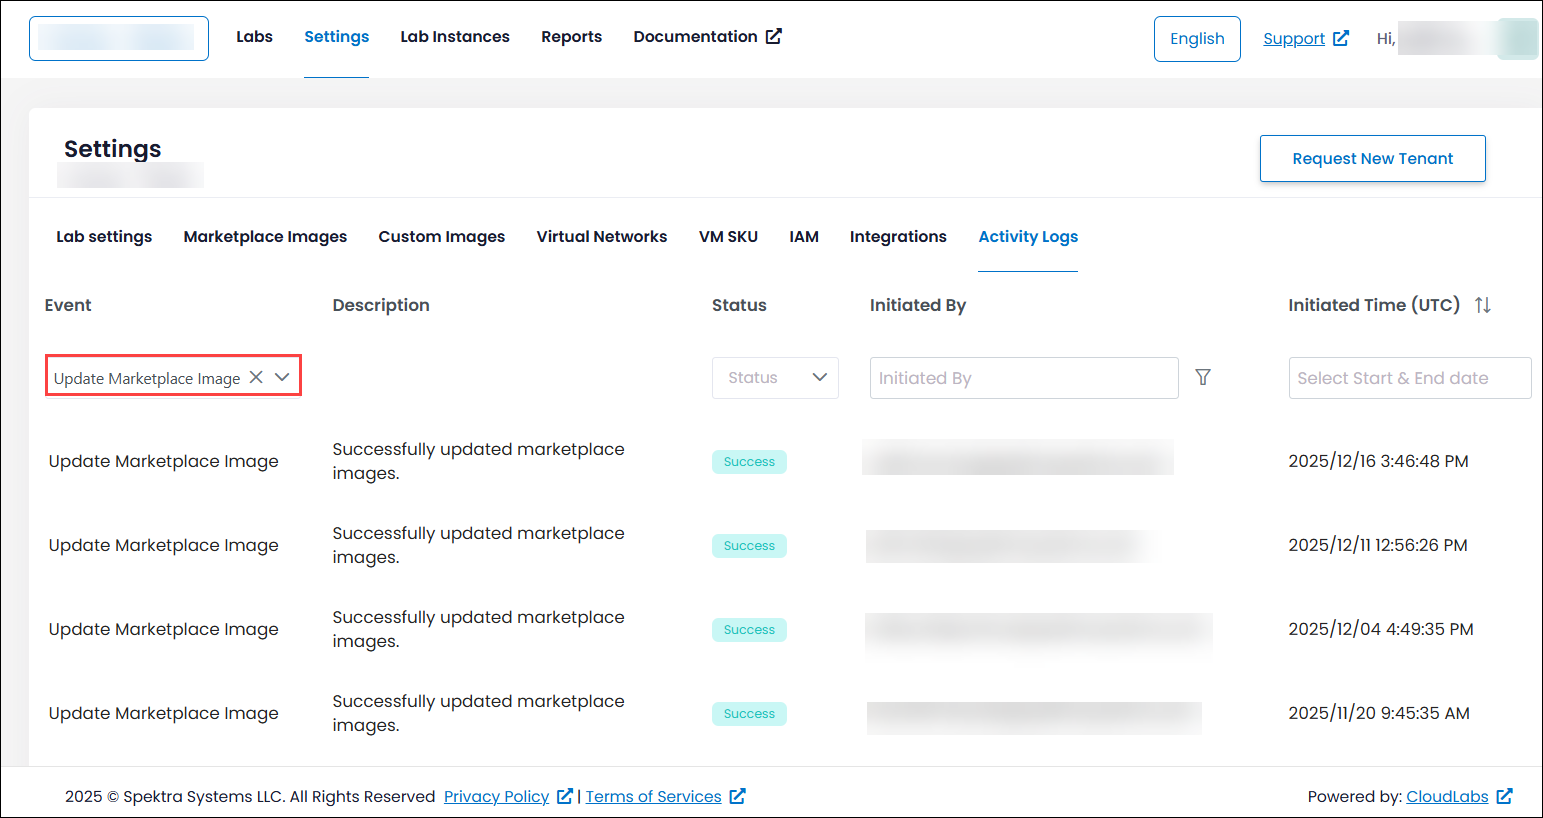
Filter by Event Type: Choose specific events such as "Sync Directory Groups" or "Update Marketplace Image" from the dropdown menu to view logs related to those actions. For instance, selecting Update Marketplace Image will display events related to image updates, these images are utilized during lab creation, while you can also select other desired events to refine your log view.
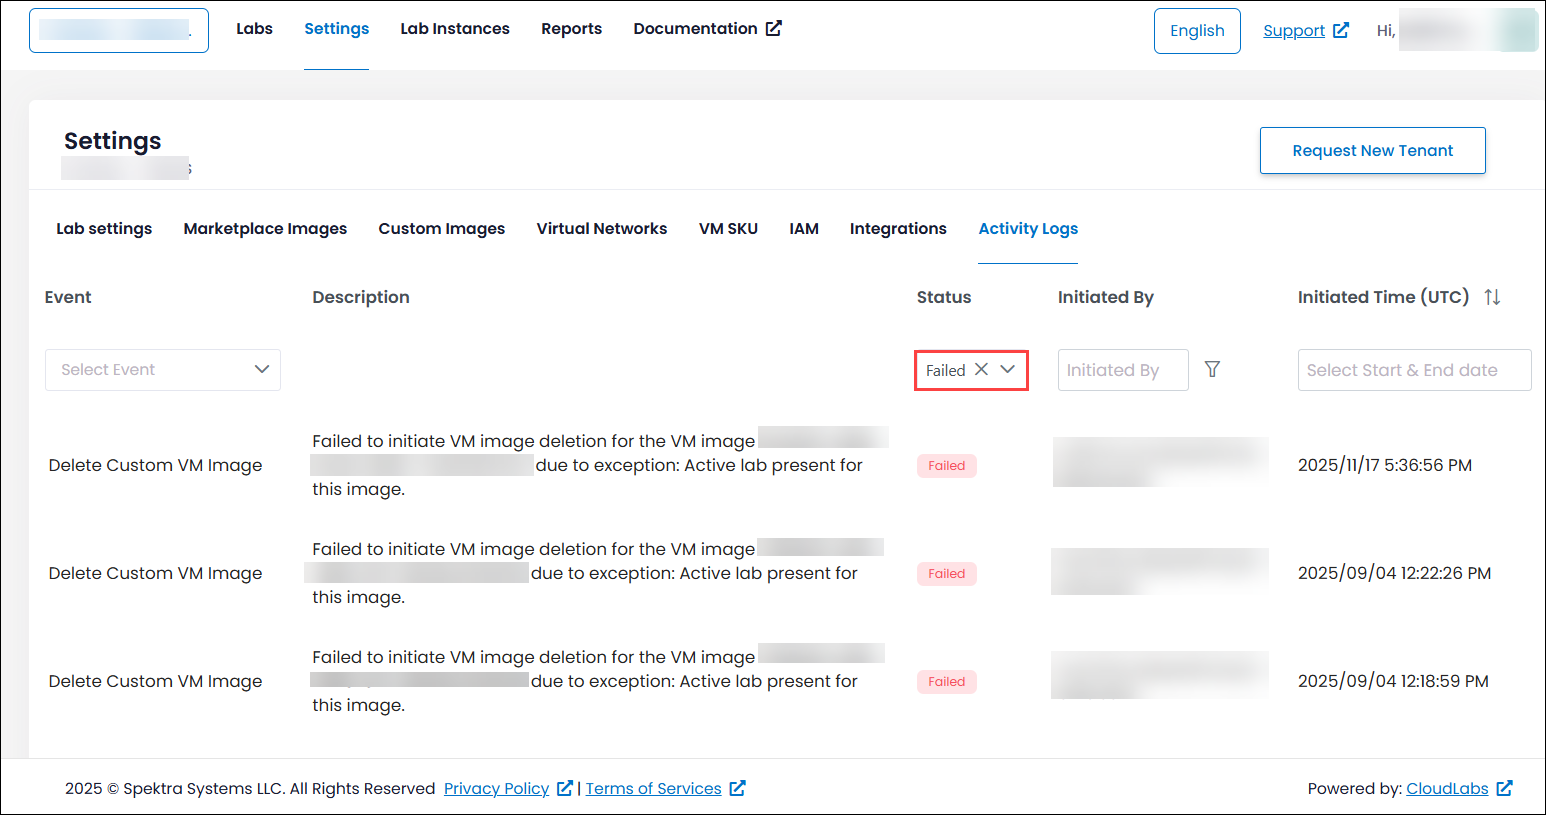
Filter by Status: Choose between "Success" or "Failed" to focus on the outcome of events. For instance, selecting Failed will highlight events that encountered issues, allowing you to address any problems.
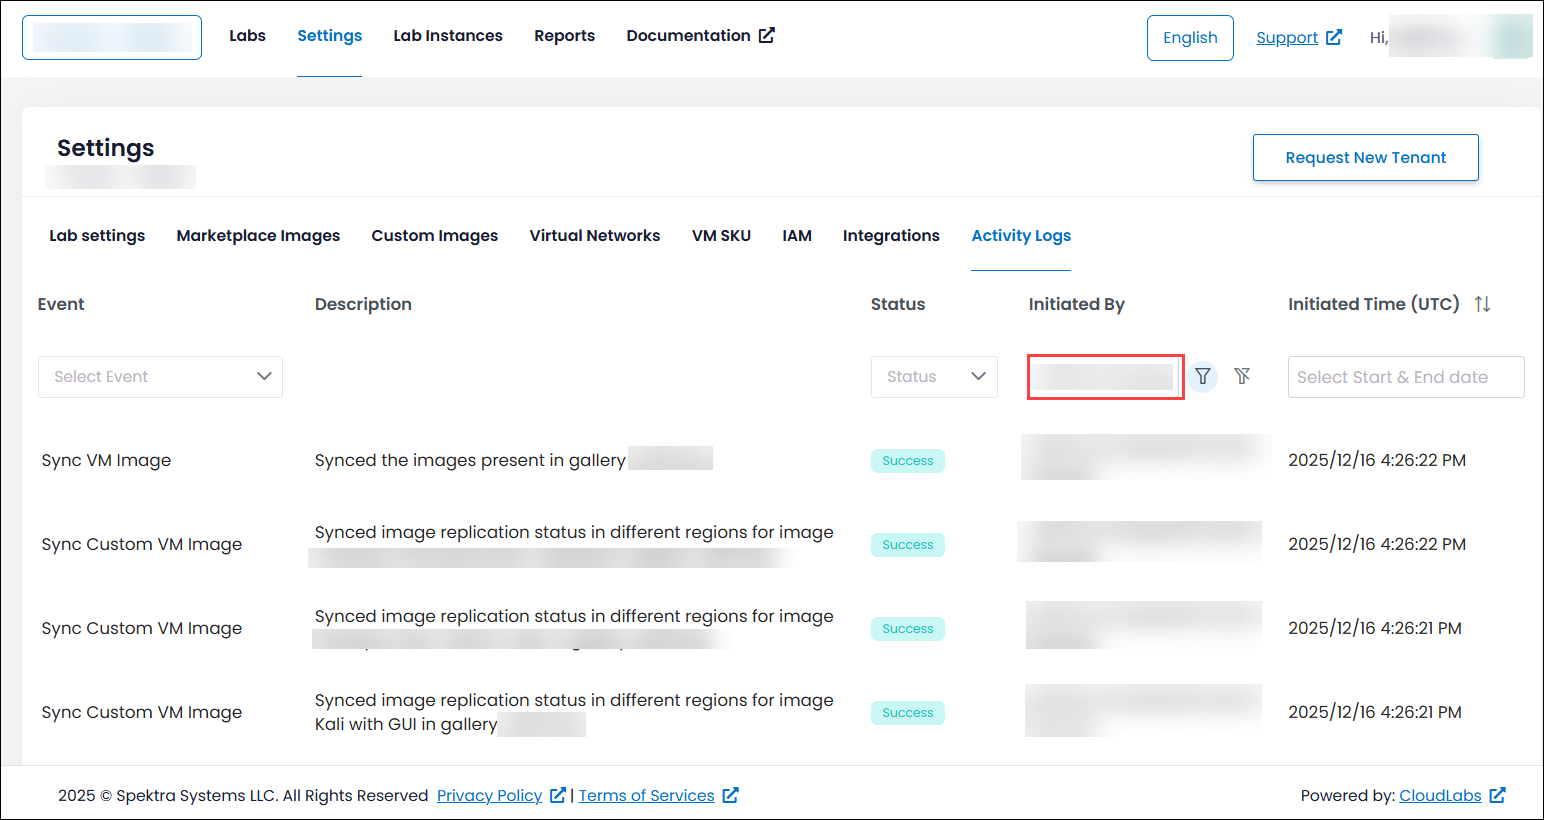
Filter by Initiated By: Specify the user or process that triggered the events. For example, selecting "username@example.com" will display logs initiated by this user.
Filter by Date Range: Set a start and end date to view logs within a specific time period. For instance, setting the date range to "December 1, 2025 - December 17, 2025" will show logs from that timeframe, helping you analyze recent activities.
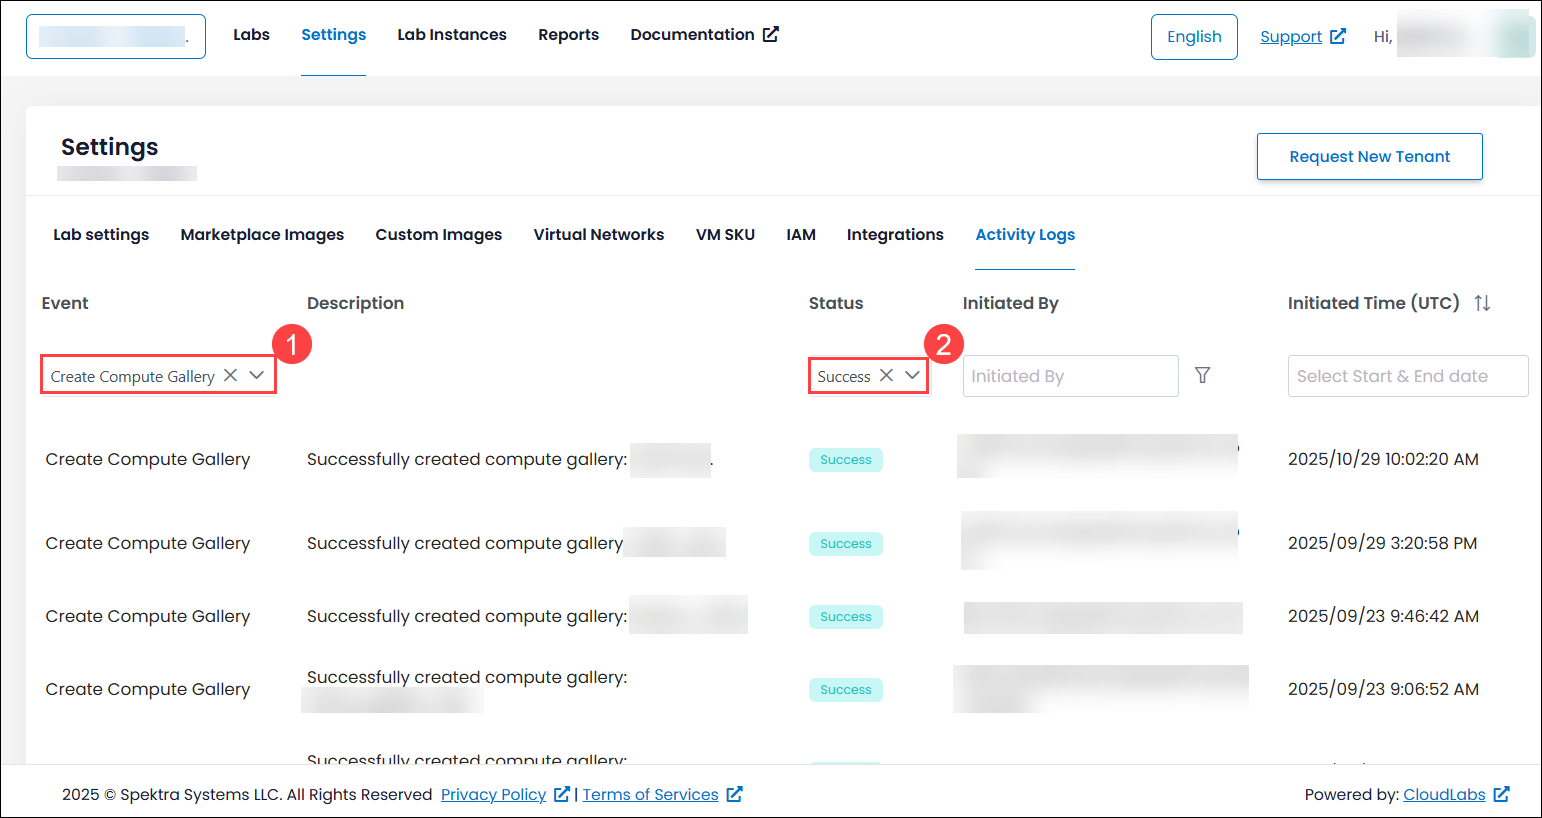
Filter by Multiple Criteria: Combine multiple filters to refine your search further. For example, selecting Create Compute Gallery (1) as the Event Type and Success (2) as the Status will show logs related to successful compute gallery creations. This combination allows you to focus on specific events with particular outcomes.
Next Steps
In this article, you have learned how to access and interpret global audit logs, as well as how to use filters to extract insightful data.
You can now start using these filtered logs to monitor global changes, troubleshoot issues, and ensure efficient management of global settings and Configurations. For detailed guidance on managing global settings and configurations, refer to the relevant articles listed below: