Overview
The dashboard provides a comprehensive view of lab details and cloud spends, enabling you to efficiently manage and monitor your lab resources and expenses. This article explains how to access and interpret the dashboard information.
By the End of This Documentation, You Should Be Able to:
Access the dashboard view for lab details.
Understand and analyze cloud spend and resource usage.
Steps to Access and View Lab Details on the Dashboard
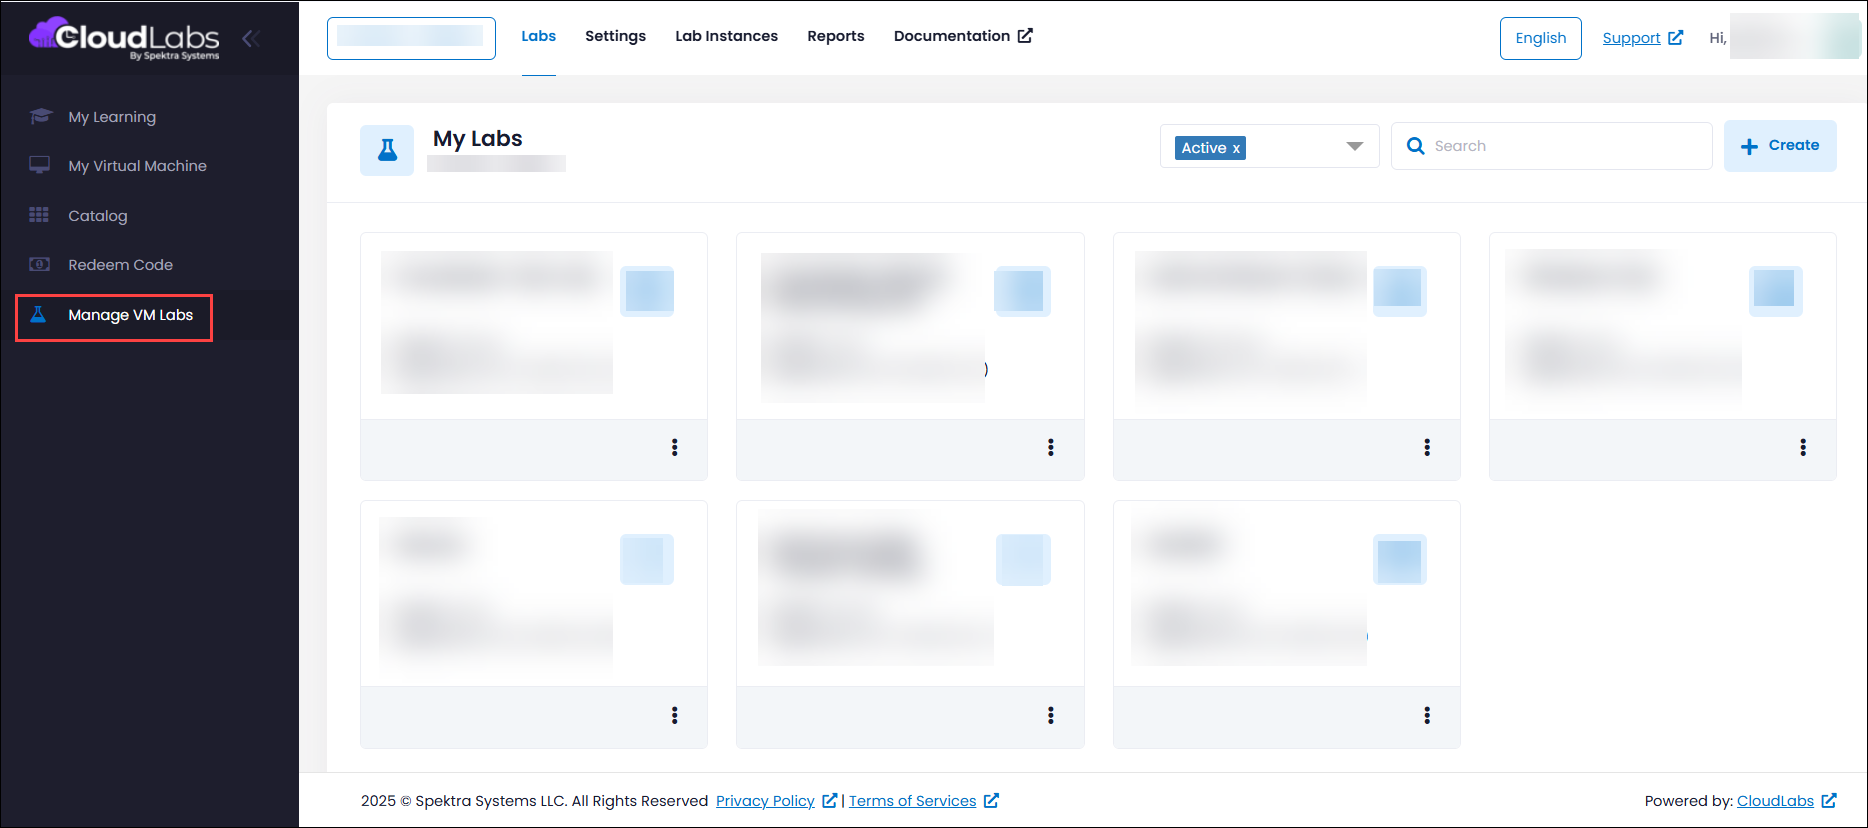
Log in to https://portal.cloudlabs.ai/ and select Manage VM Labs.
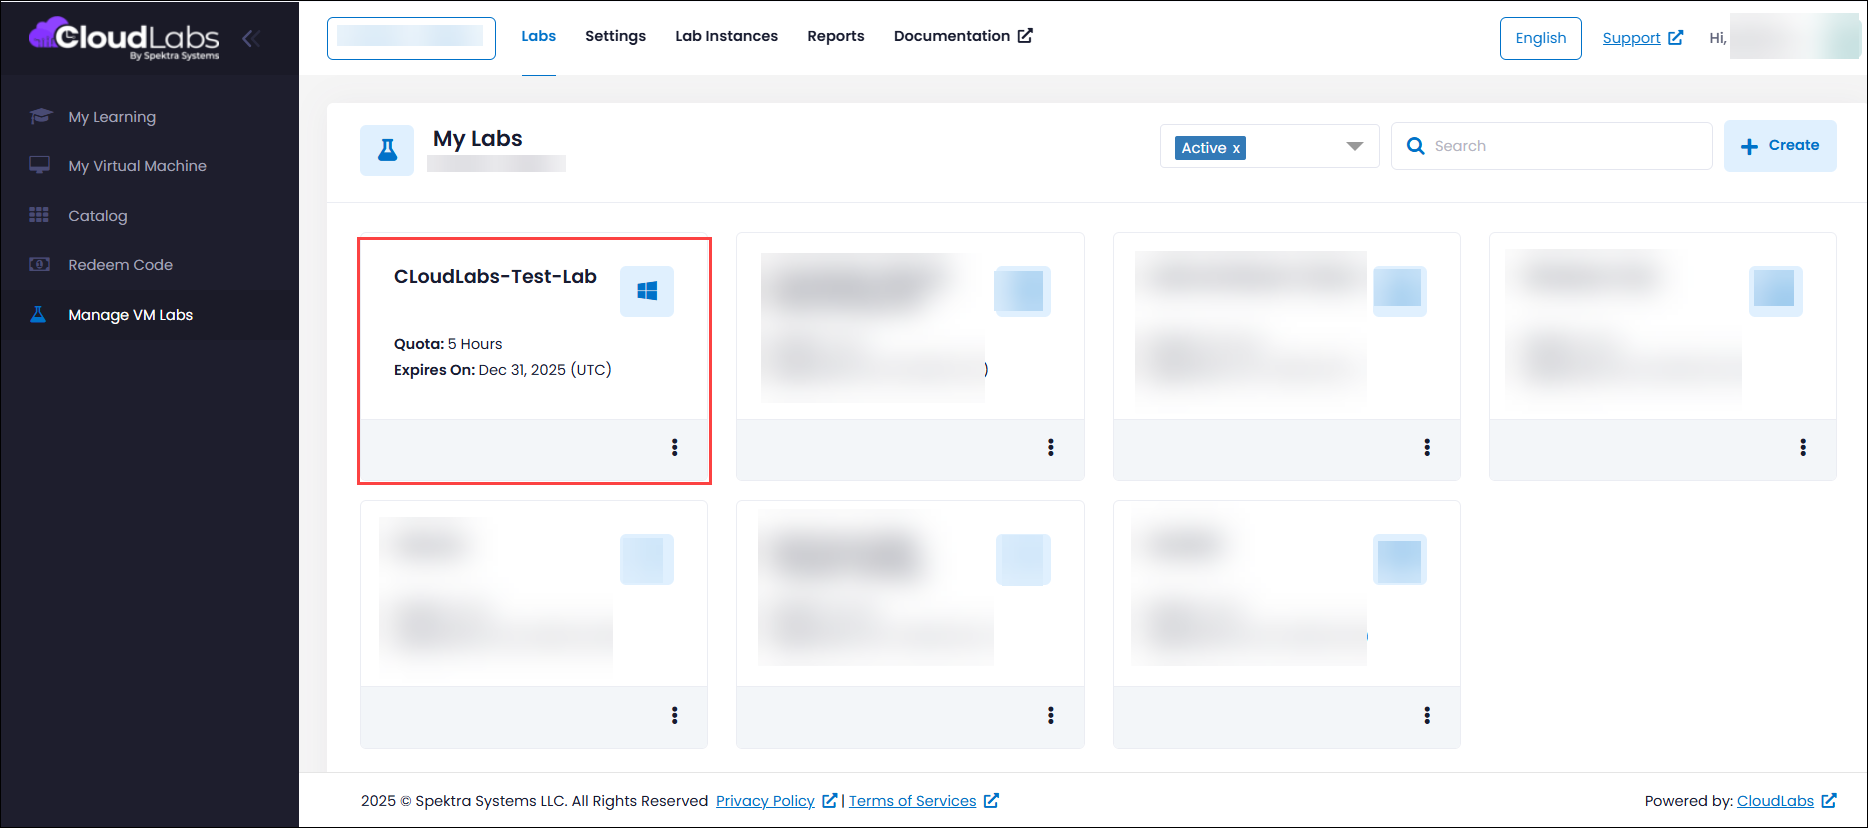
Navigate to the Desired Lab. Click on the lab to open its detailed dashboard view.
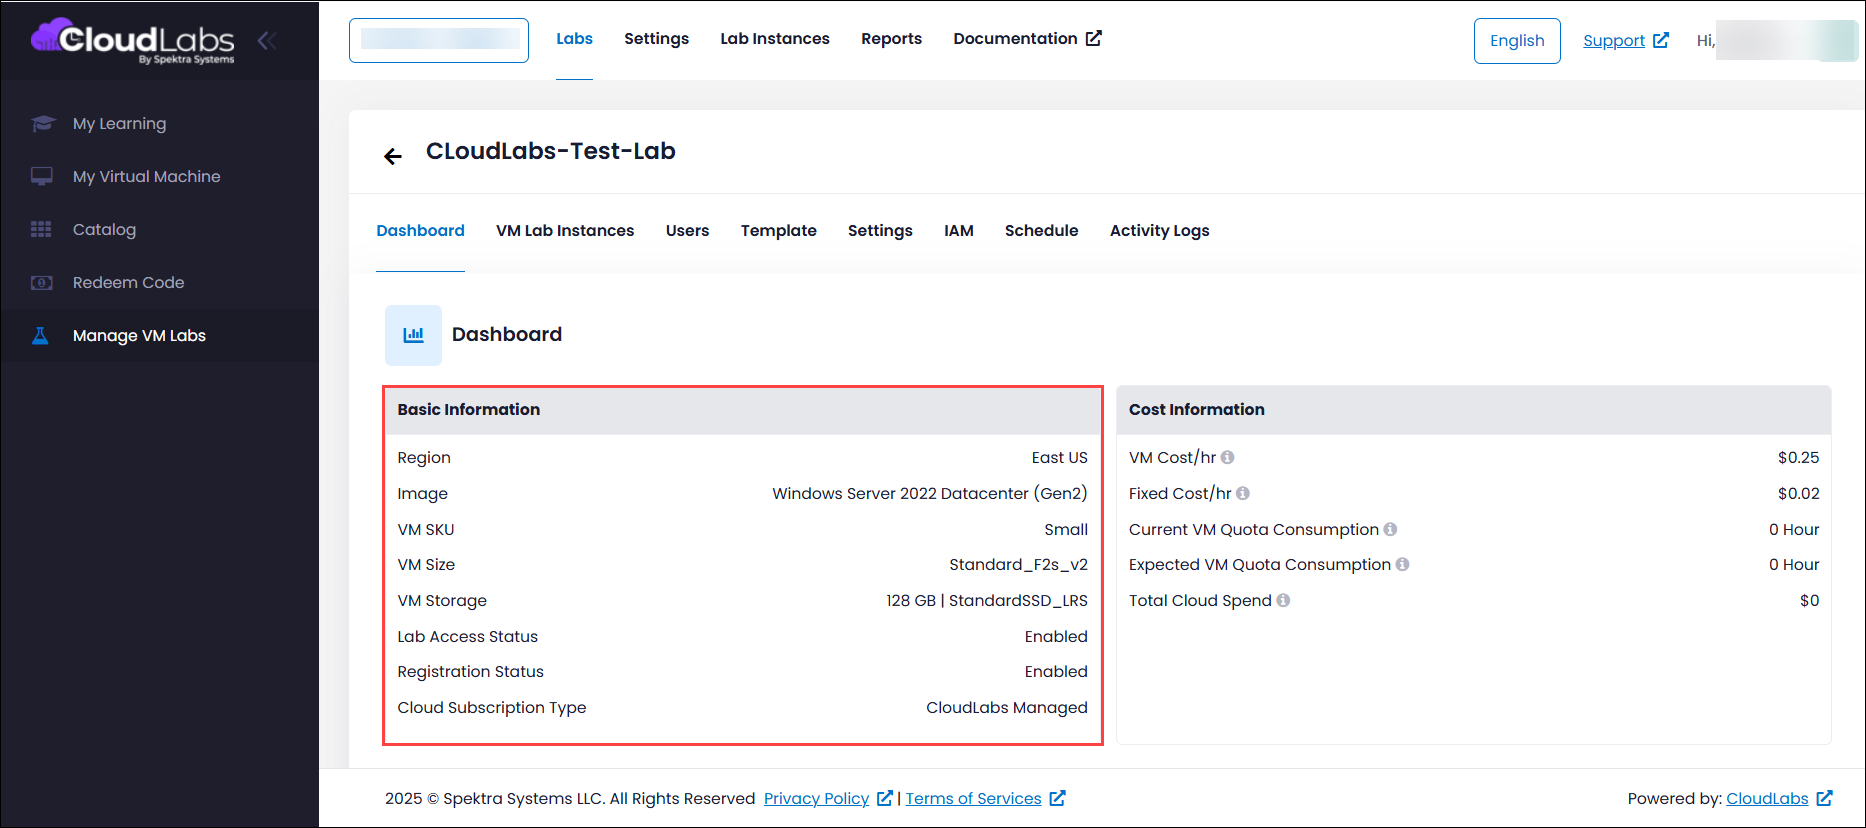
The dashboard offers detailed insights into various aspects of your lab, including its configuration, storage, access, and cloud subscription information. Below is an outline of the key components covered under Basic Information:
Region: Displays the geographic location where your lab resources are hosted.
Image: Shows the image used for the VM instances in the lab.
VM SKU and Size: Provides information about the VM types and sizes used in your lab.
VM Storage: An overview of the storage allocated to VM instances within the lab.
Lab Access: Information about user access and permissions for the lab.
Registration Status: The current status of the lab’s registration.
Cloud Subscription Type: Provides type of cloud subscription associated with the lab, either Cloudlabs Managed or Customer Managed Subscription.
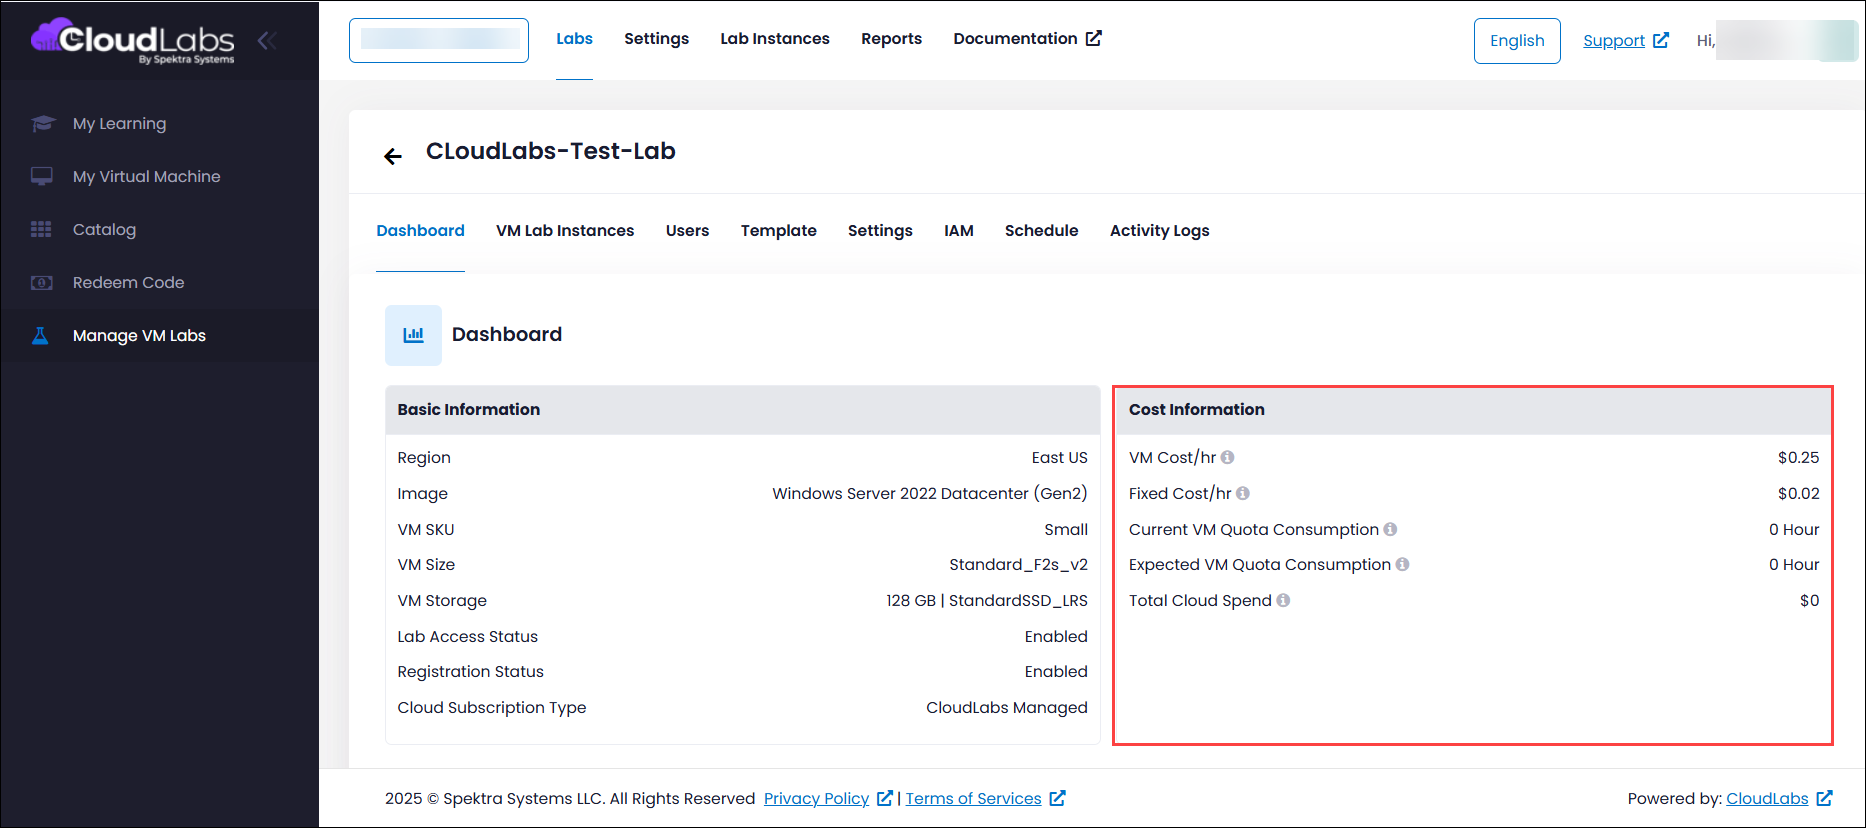
The dashboard also provides cost information, including hourly VM costs, fixed costs, current and expected VM quota consumption, and total cloud spend.
Hourly VM Costs: Displays the cost associated with running each VM per hour.
Fixed Costs: Shows any fixed costs related to the lab setup or configuration. This includes one-time or recurring charges for VM storage and IP address allocation.
Current and Expected VM Quota Consumption: Provides insights into the current usage of VM quotas also the Expected VM quota.
Total Cloud Spend: Summarizes the total expenditure for the lab.
In the Lab Instances section of the dashboard, you can view the status of lab instances. However, these details will only be shown if instances have been provisioned. If no instances are provisioned after creating a lab, the lab Instance section will not display any information.
a. This section of the dashboard provides a detailed overview of deployment status. It shows the count of
deployments that are currently active, as well as those that have been stopped or deleted.
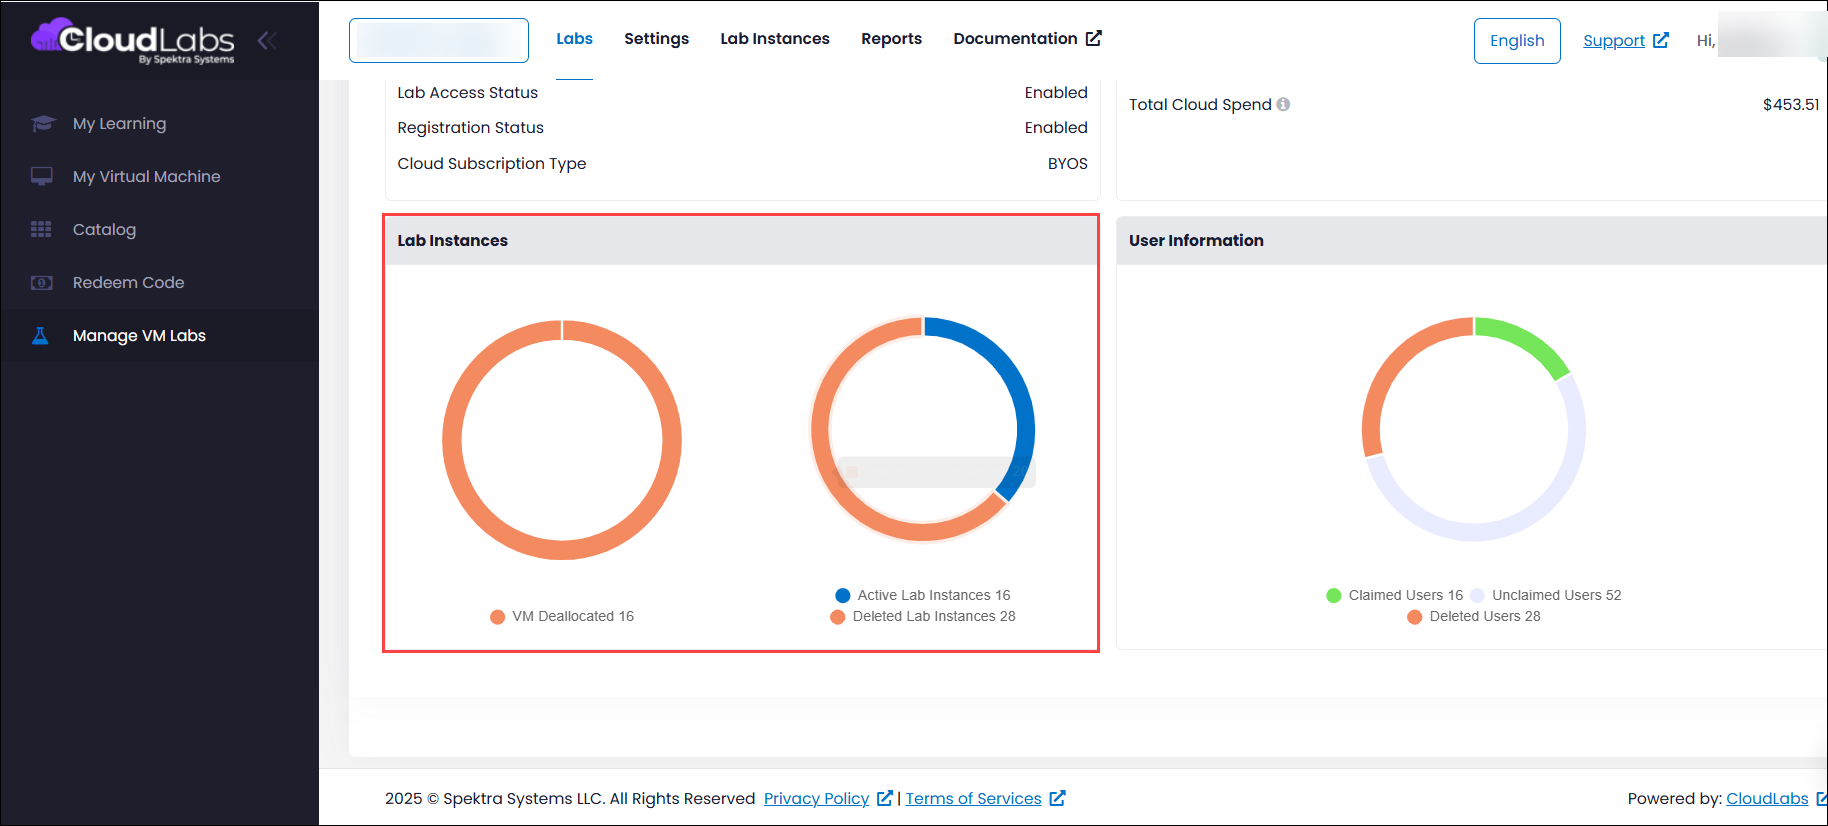
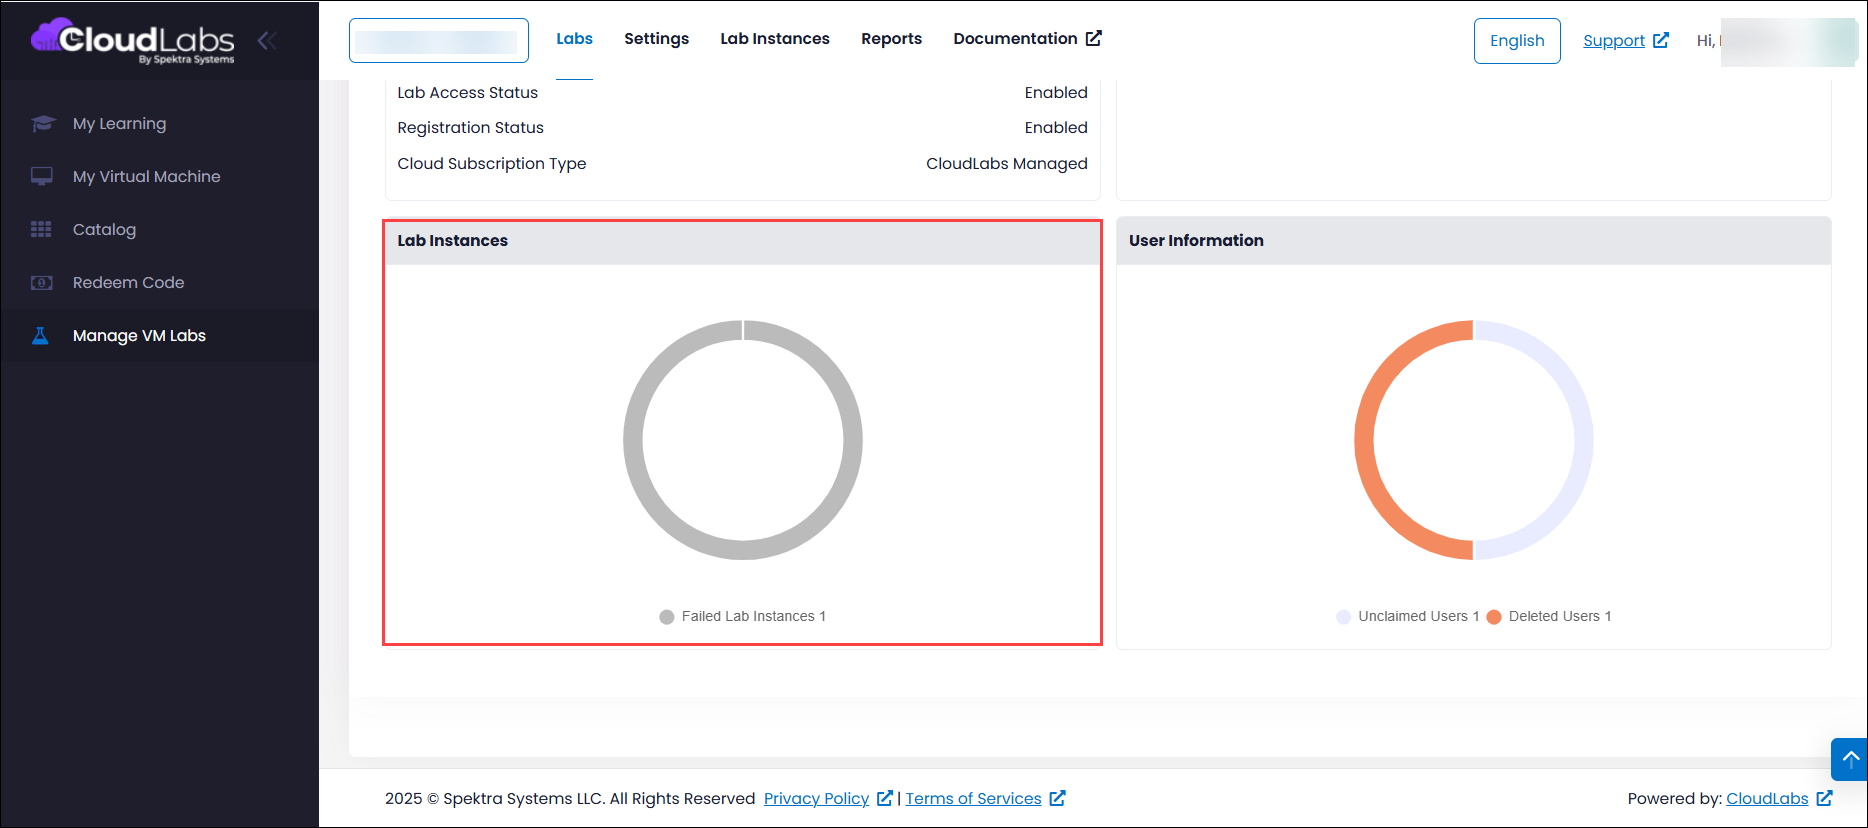
b. The lab instances also specifies the count of deployments that have been failed.
Note:
When an instance is provisioned from the VM Lab Instances tab of the lab and if the deployment initiation fails, the system will automatically delete the VM. The failed Instance will not appear under VM Lab Instances, in order to investigate the cause of failure you can view the Activity section of the lab. As the VM is deleted automatically , it will be listed under the “Deleted Lab Instances” section of the dashboard.
If the instance is provisioned by a user from the Manage Labs section of the portal and if the deployment initiation fails, the VM failure will be visible under VM Lab Instances, You can click on the “i” icon to view the cause of the failure or check the Activity section of the lab for further details. In the dashboard, the failure will be listed under the VM Failed section
In scenarios where the deployment fails after initiation, regardless of whether the deployment fails from the user’s end or while provisioning through the VM Lab Instances, the failure will be displayed under VM Lab Instances. Additionally, it will be listed under the VM Failed section of the dashboard
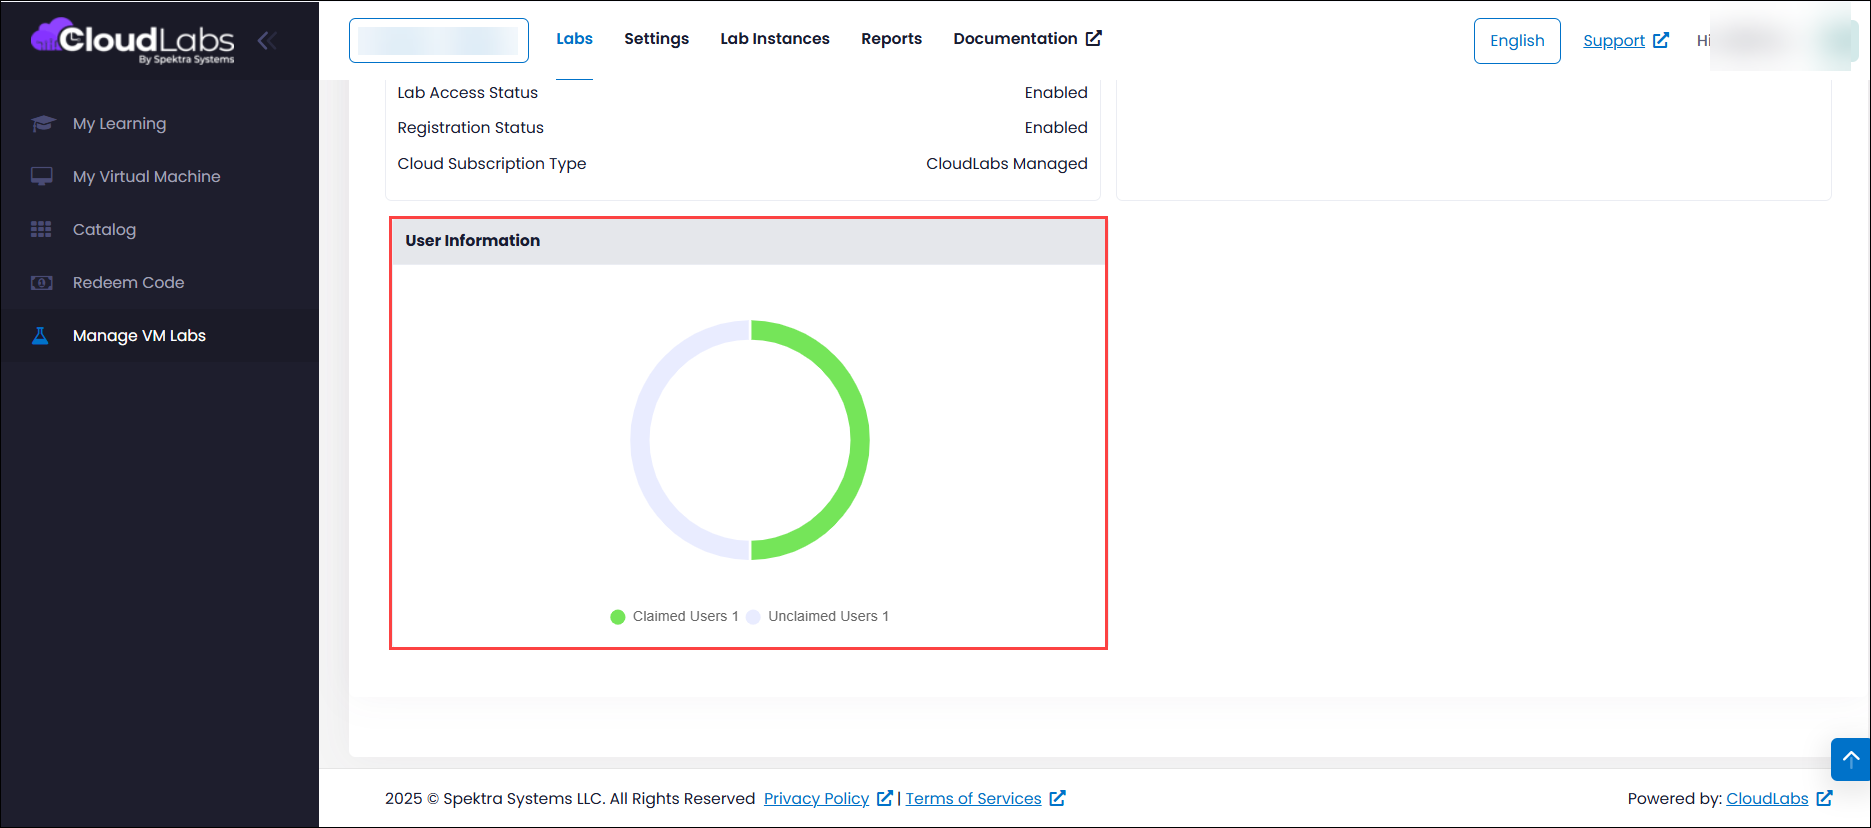
In the User Information section, you can view the number of users who have claimed access to the lab as well as those who have not yet claimed it. However, this information will only be displayed if users have been added to the lab. If no users are added, the User Information section will not show any details.
Next Steps
Now that you have learned how to access and interpret the dashboard, you can start utilizing this information to manage your lab resources and monitor cloud spends effectively.
For further actions, you can refer to the following guides: