Overview
The audit logs at Lab Level provide a detailed overview of events and activities within lab environment. By accessing and analyzing these logs, you can monitor various operations, track user actions, and ensure the smooth functioning of your lab resources. This article explains how to access and interpret the audit log information.
By the End of This article, You Should Be Able to:
Access the audit logs for lab activities.
Understand and analyze the events and actions recorded in the logs.
Filter the logs to extract meaningful insights.
Steps to Access and View Audit Logs
Follow the below steps to Access and View Audit Logs
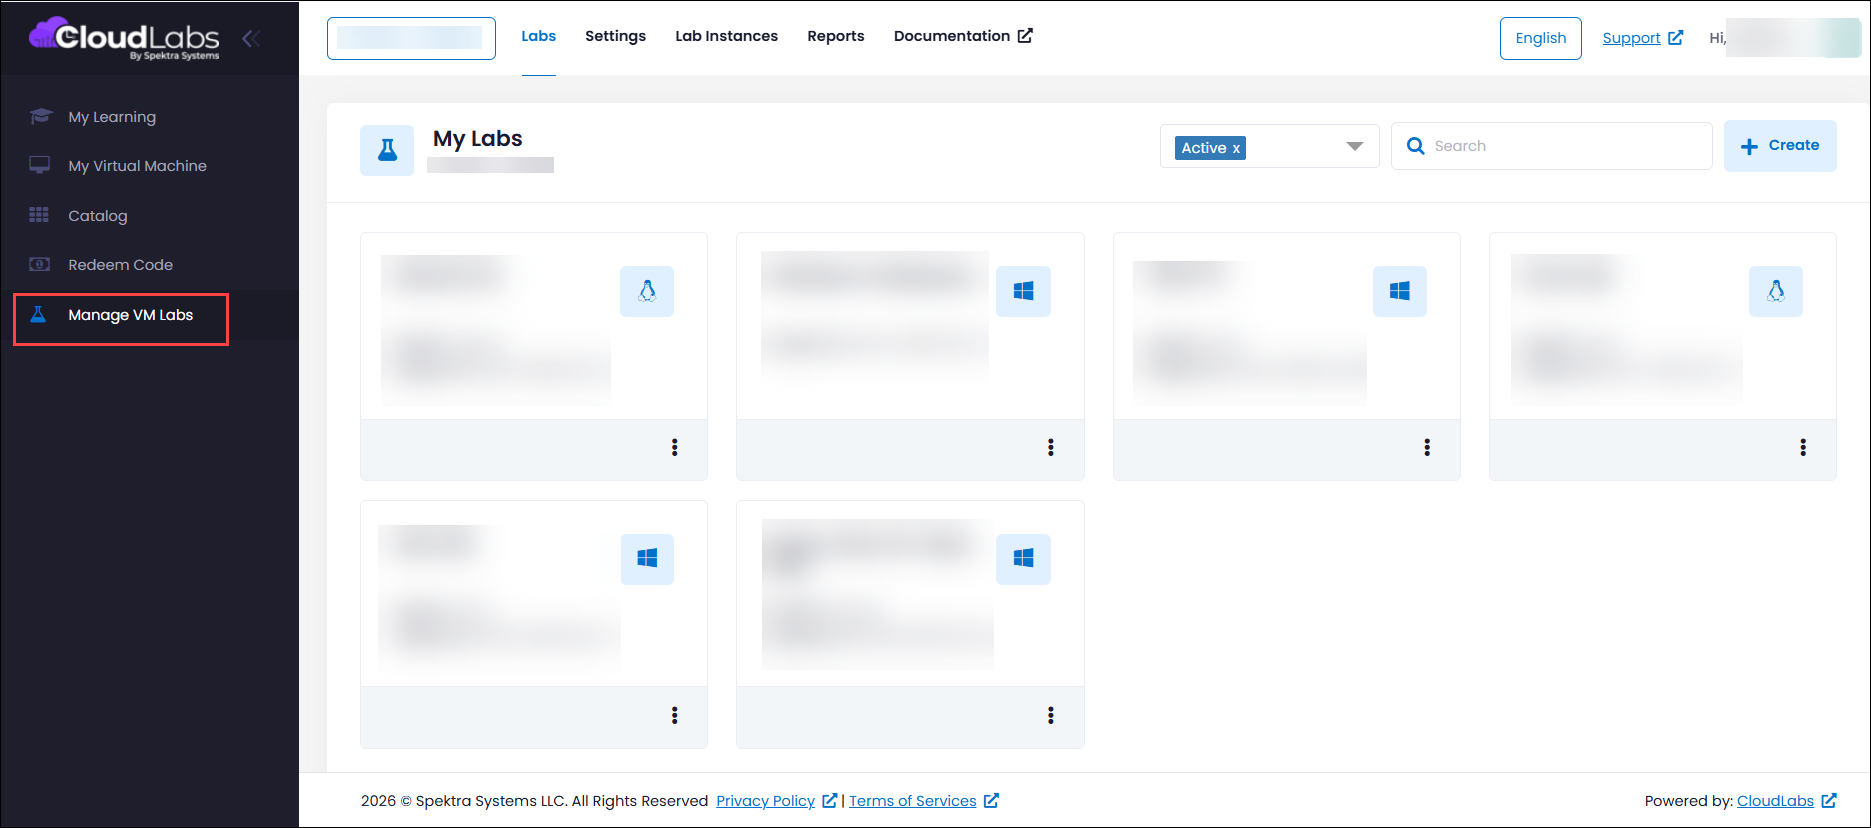
Log in to https://portal.cloudlabs.ai/ and select Manage VM Labs.
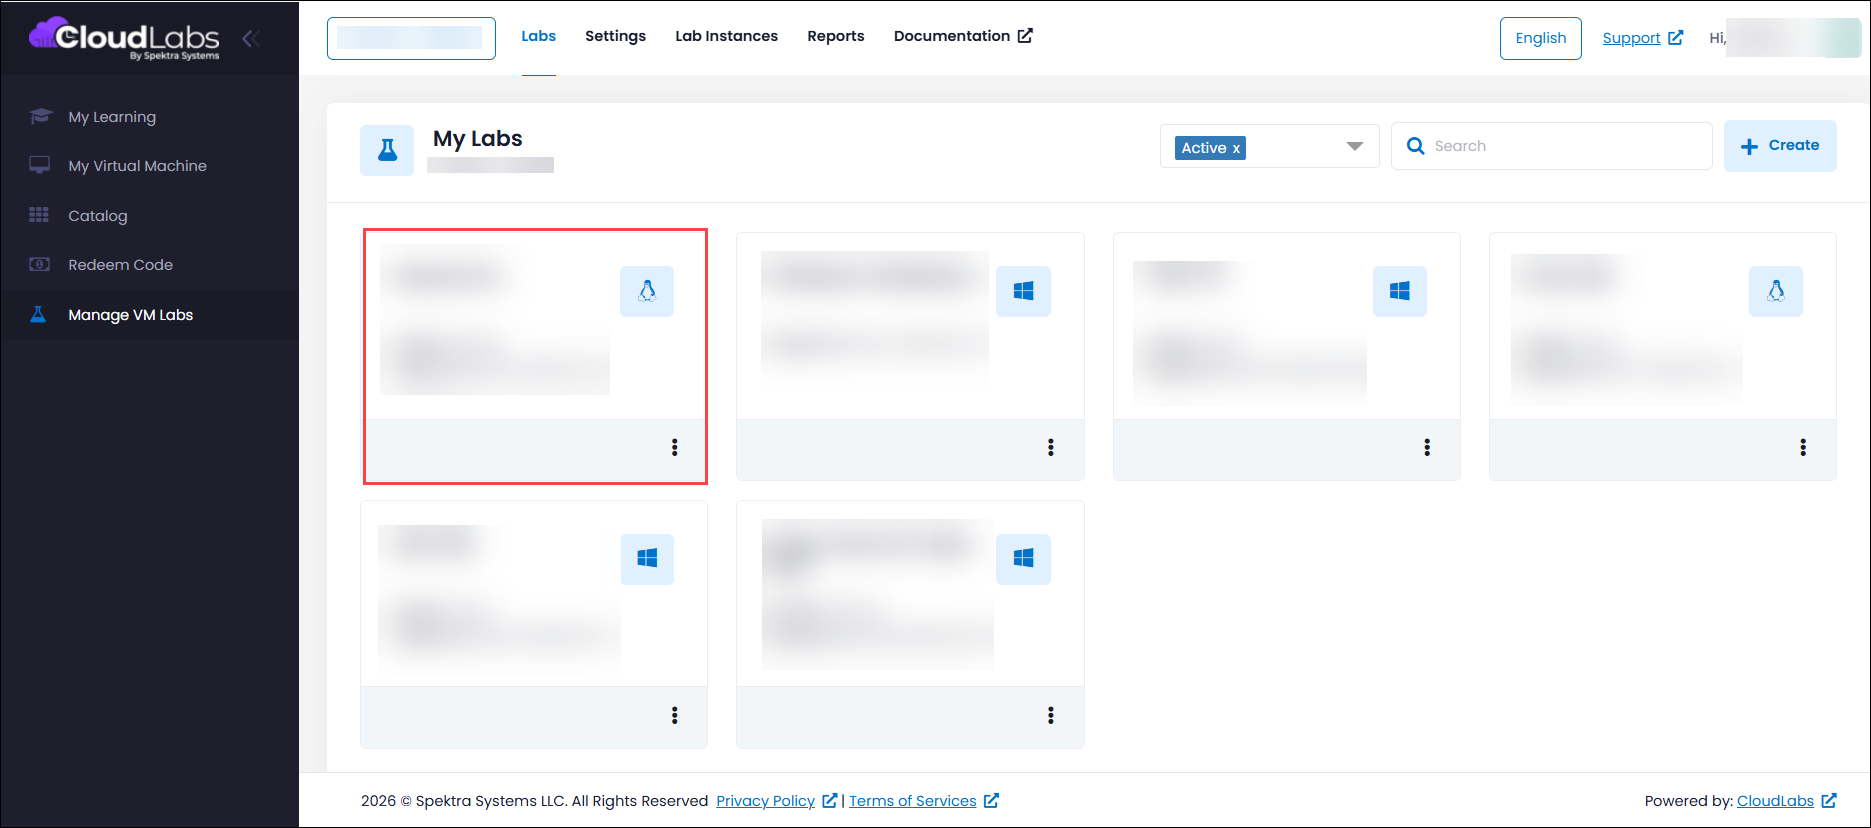
Navigate to the Desired Lab. Click on the lab to open its detailed Audit Logs
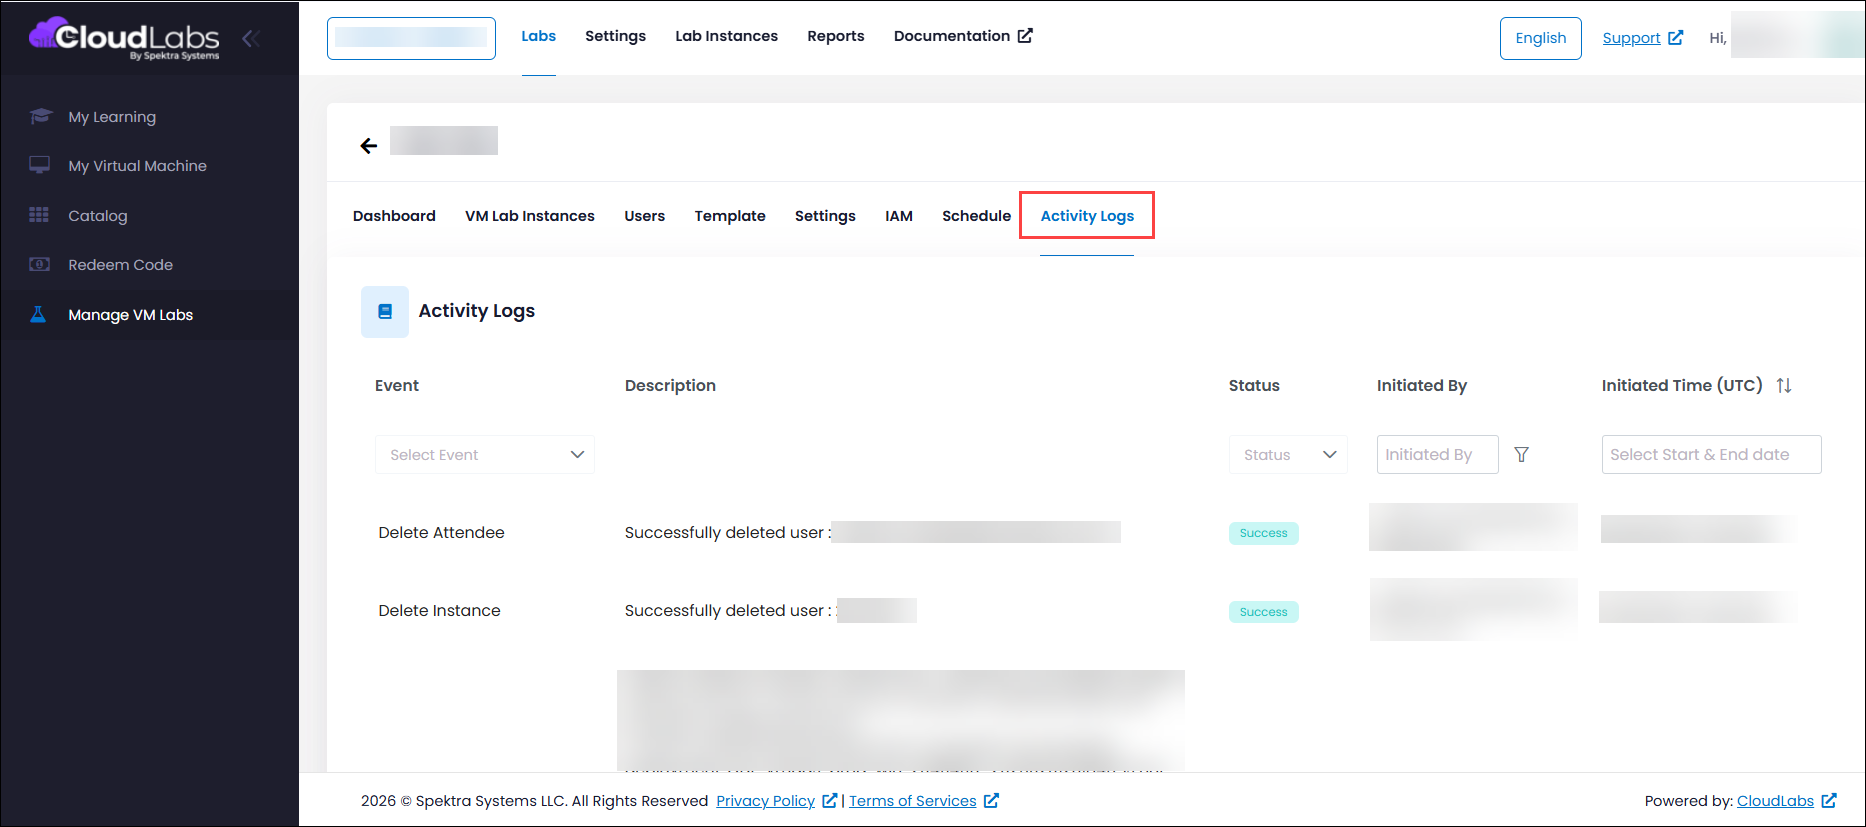
To view detailed logs of all events related to the lab, navigate to the Activity Logs section. Once your in the Activity Logs section, you will see a list of all events that have occurred in the lab.Below is an outline of the key components covered under Activity Logs:
Event: Displays the type of event, such as "Start VM" or "Sync Entra ID Group Members."
Description: Provides a brief summary of the event.
Status: Shows whether the event was successful or failed.
Initiated By: Indicates who or what triggered the event (e.g., user email or automated process).
Initiated Time: The timestamp, including both date and time, indicating when the event occurred.
Note:
In the event of any failure, please be aware that activity logs may take a few minutes (typically 2-3 minutes) to appear. This delay is similar to the time required for the Azure portal to process and display logs.
Filtering Events
To refine the audit logs based on specific criteria, use the filtering options available to narrow down the events. You can filter by event type, status, initiated by, and date range to focus on relevant entries.
Filter by Event Type: Choose specific events such as "Start VM" or "Sync Entra ID Group Members" from the dropdown menu to view logs related to those actions. For instance, selecting "Start VM" will display details of VM start events, while you can also select other desired events to refine your log view.
.png)
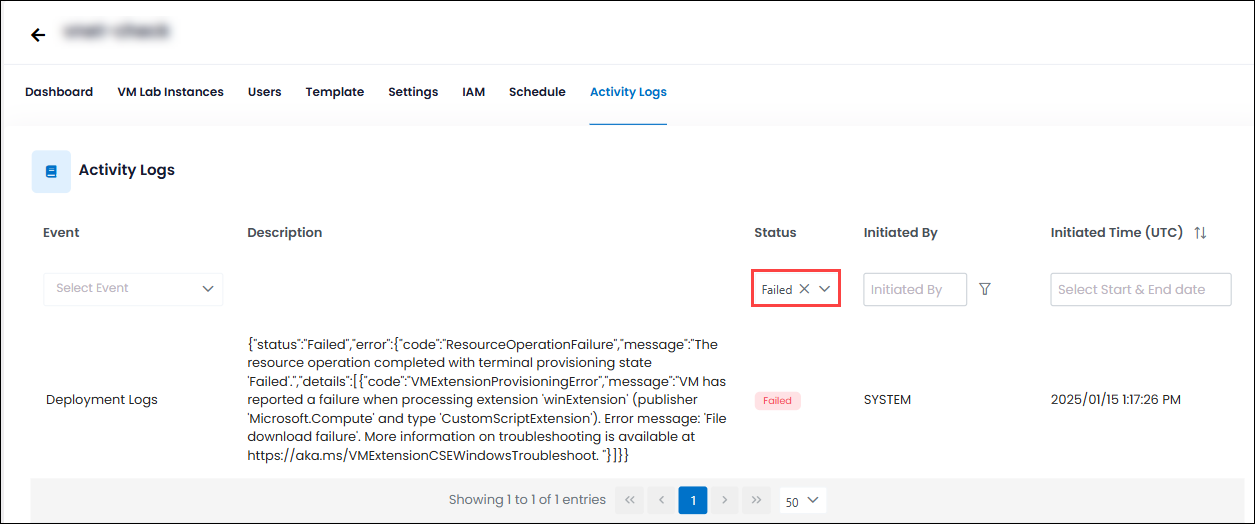
Filter by Status: Choose between "Success" or "Failure" to focus on the outcome of events. For instance, selecting "Failure" will highlight events that encountered issues, allowing you to address any problems.
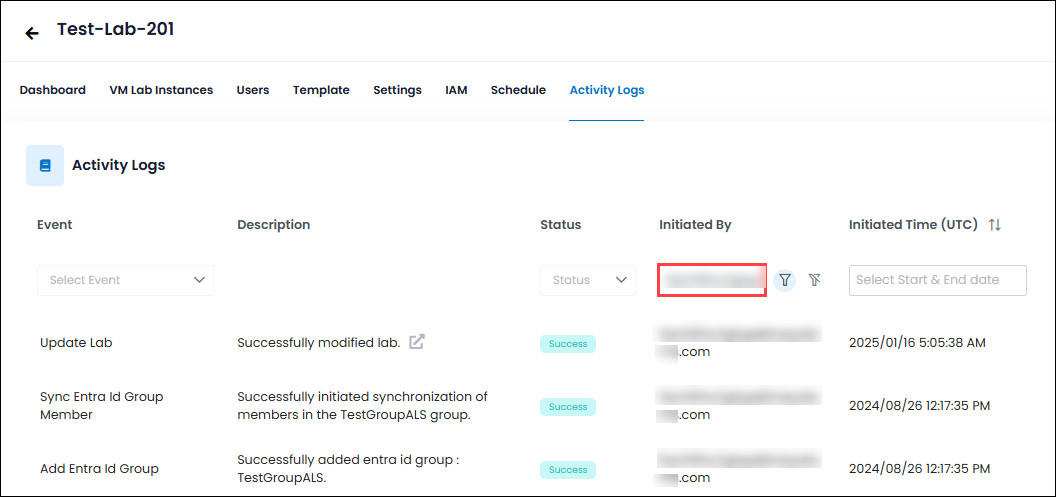
Filter by Initiated By: Specify the user or process that triggered the events. For example, selecting "username@example.com" will display logs initiated by this user.
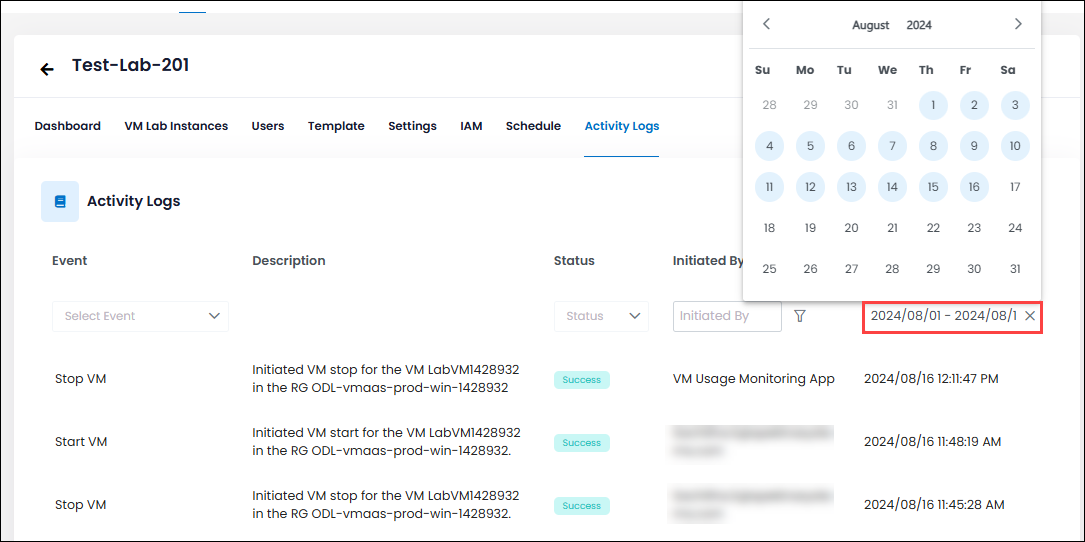
Filter by Date Range: Set a start and end date to view logs within a specific time period. For instance, setting the date range to "August 1, 2024 - August 16, 2024" will show logs from that timeframe, helping you analyze recent activities.
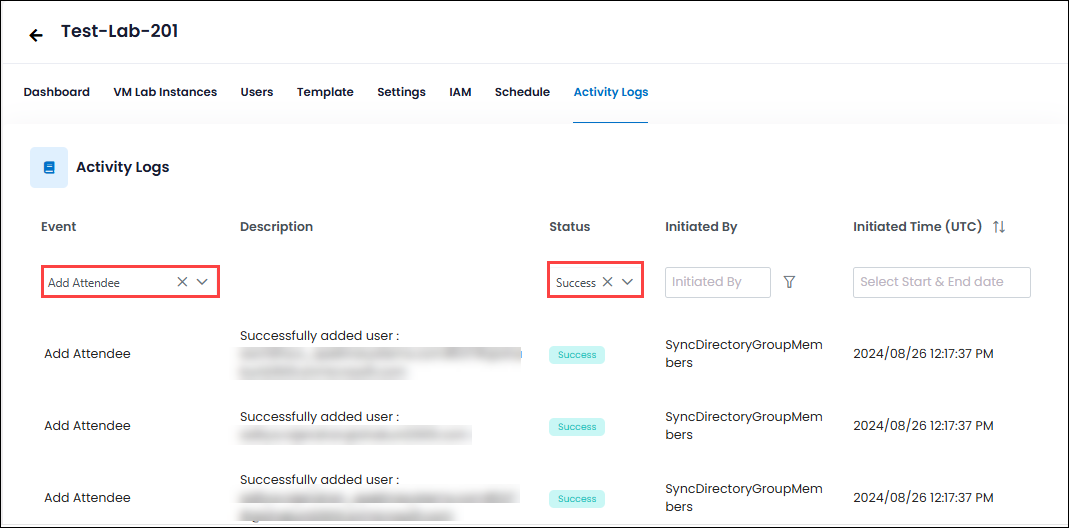
Filter by Multiple Criteria: You can combine multiple filters to refine your search further. For example, selecting "Add Attendee" as the Event Type and "Success" as the Status will show logs related to successful attendee additions. This combination allows you to focus on specific events with particular outcomes.
Next Steps
In this article, you have learned how to access and interpret audit logs, as well as how to use filters to extract insightful data.
You can now start using these filtered logs to monitor lab activities, troubleshoot issues, and ensure compliance. For detailed guidance on managing lab resources , refer to the Manage Lab Instances article.