Overview
In this article, you’ll learn about reports and how to monitor your labs. CloudLabs VM Labs allows you to monitor your labs with ease using Power BI reports. You get access to comprehensive details about labs, including monthly spending, users, and many more.
By the end of this article, you will be able to:
Understand and read reports
Alter the report to get insightful data using filters
Understand and Read Reports
Follow the steps to visualize the report:
Login to https://portal.cloudlabs.ai/.
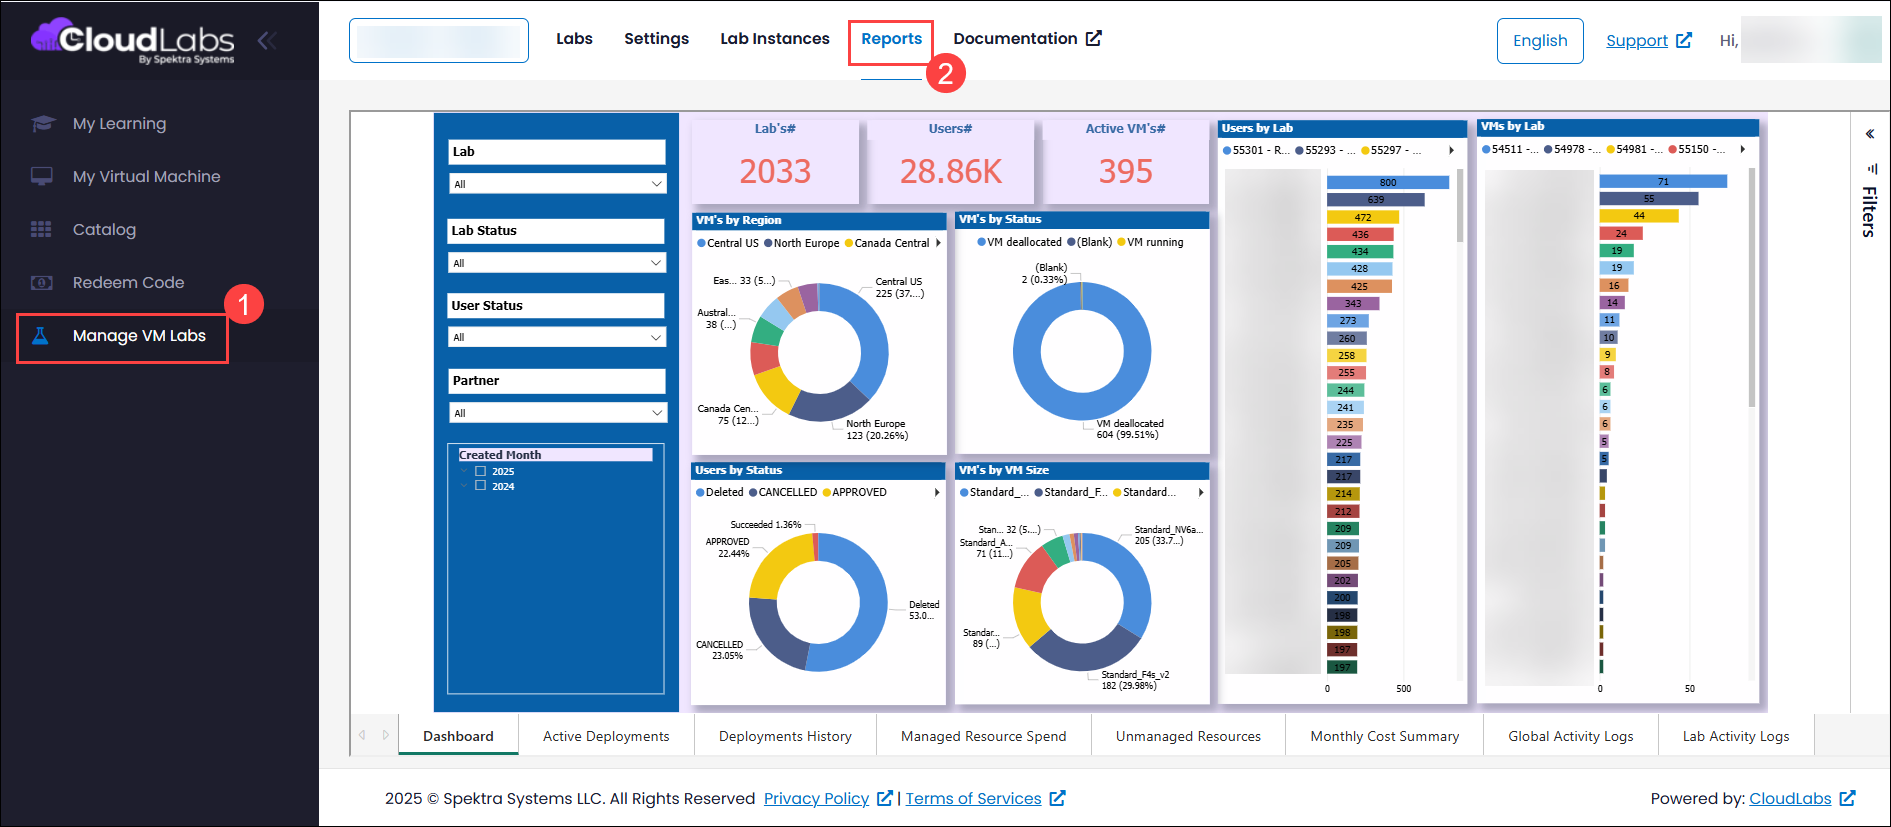
Navigate to Manage VM Labs (1) > Reports (2). You’ll be able to visualize a detailed report on your hosted VM labs.
Dashboard
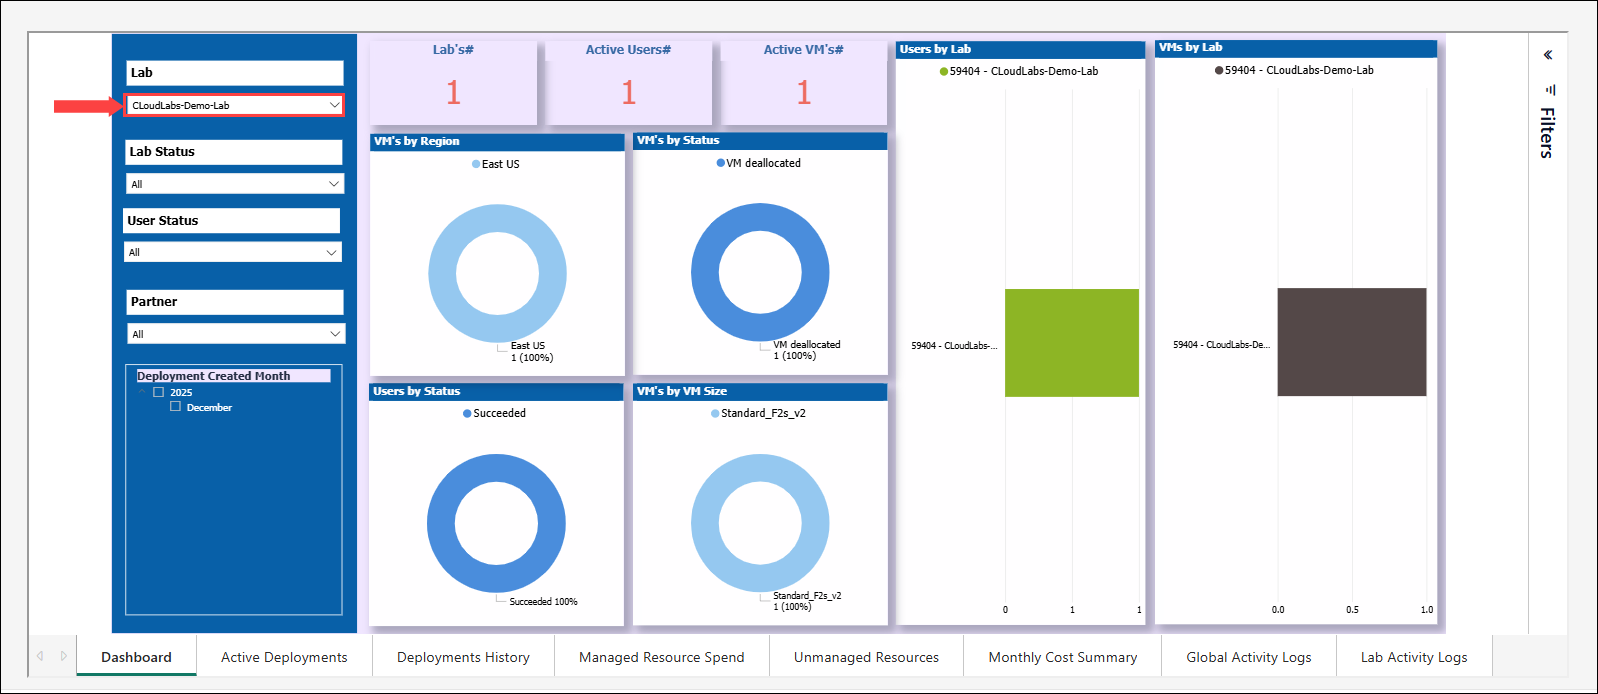
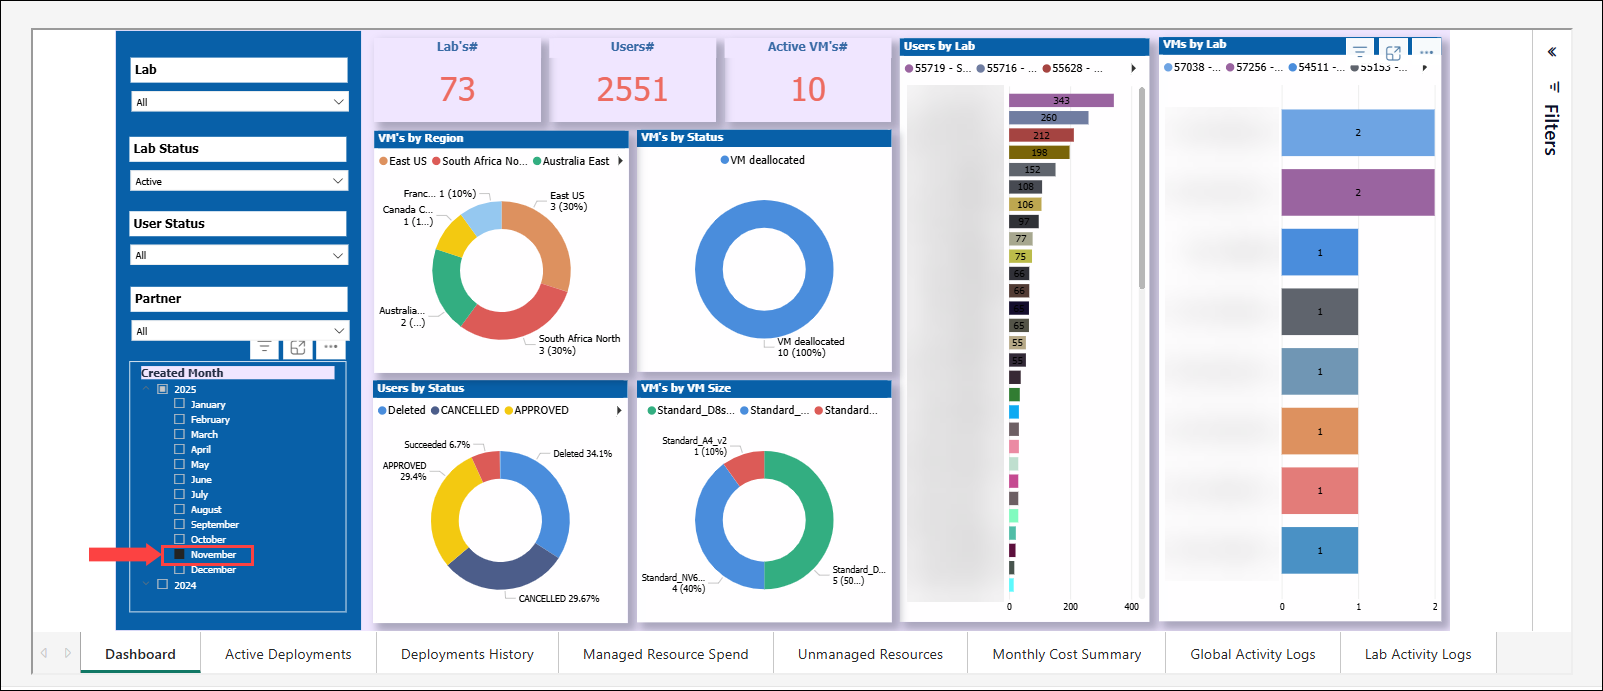
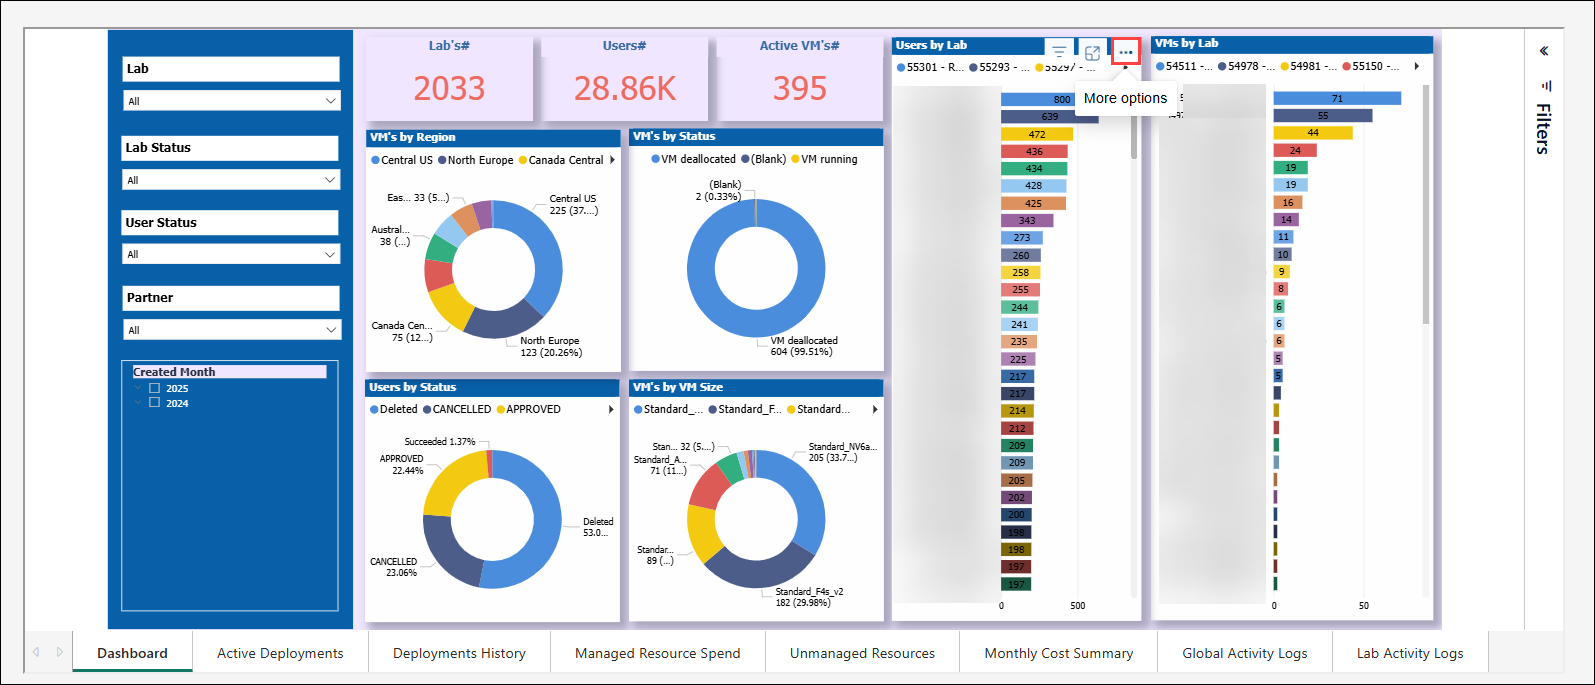
The Dashboard provides an overview of Labs, Users, and Active VM Instances, along with insights into deployments, VM status, and user activity. It includes interactive filters to customize reports for better decision-making and lab management.
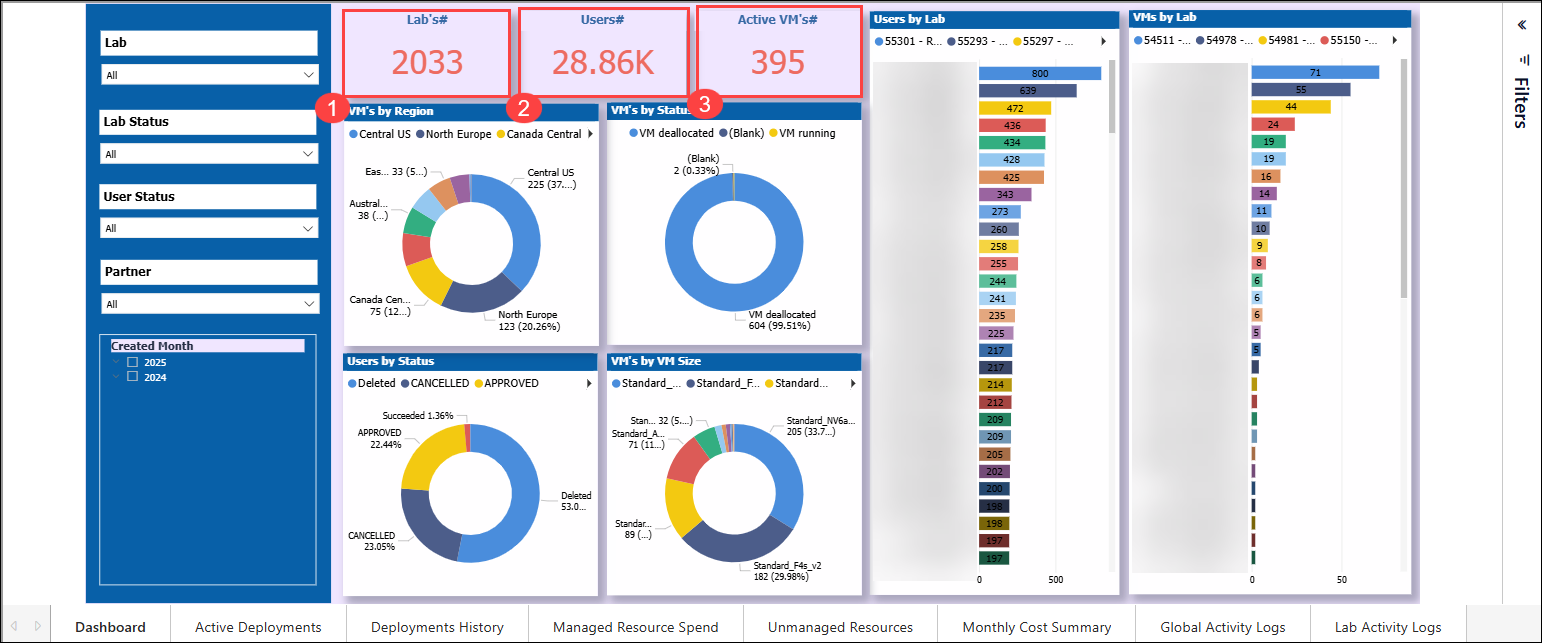
On the top, you will see the number of VM Labs hosted (1), Users (2), and Active VM Instances (3).
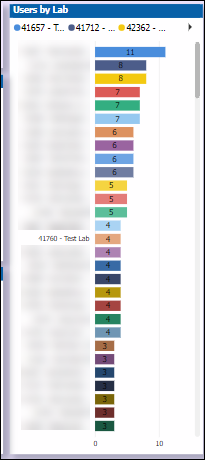
On the right-hand side, you’ll see the Users by Lab slide, which lists the number of users per lab. Also, you will see the VM’s by Lab slide, which provides the count of Number of VM’s that are currently deployed per Lab.
.png)
In the middle portion of the report, you will find 4 different slides:
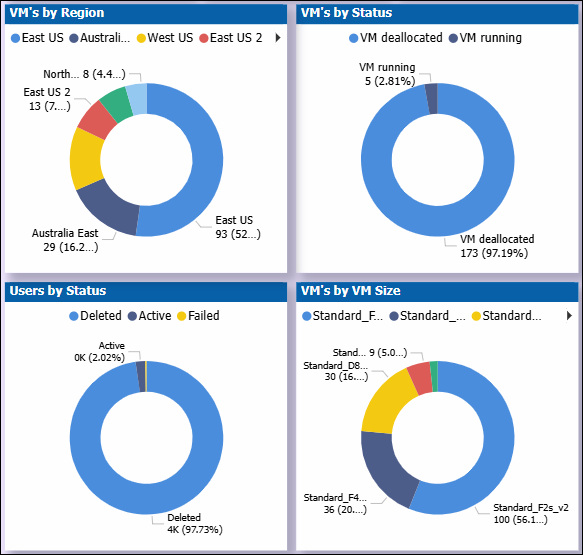
VM’s by Region: This chart shows the regions where VMs have been deployed, giving a breakdown of the number of VMs per region..
VM’s by status: This chart provides insights into how many VMs are running, deallocated.
Users by status: This chart details the number of active users with VMs deployed, and those whose VMs are deleted.
VM’s by VM Size: This chart shows the different VM sizes utilized for deployment across the labs.
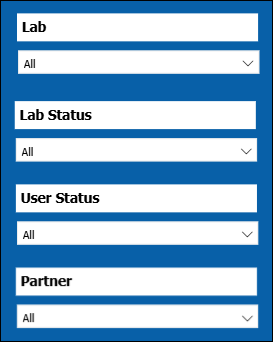
On the left side of the report, you will find a Lab filter, Lab Status , User Status filter, and Month Year filter.
Lab Filter: This allows you to filter the data by specific labs.
Lab Status: This allows you filter based on Lab Status i.e., Active and Decommissioned Labs
User Status Filter: Enables filtering by user status.
Partner: This allows you to filter the data by specific tenant, if you have access to multiple CloudLabs VM Labs tenants.
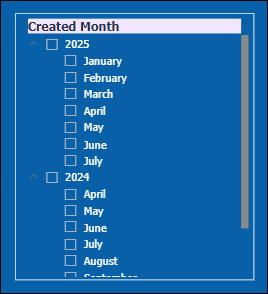
Created Month Filter: Provides the ability to filter data by the lab creation month and year for more detailed insights.
Altering Reports with Filters
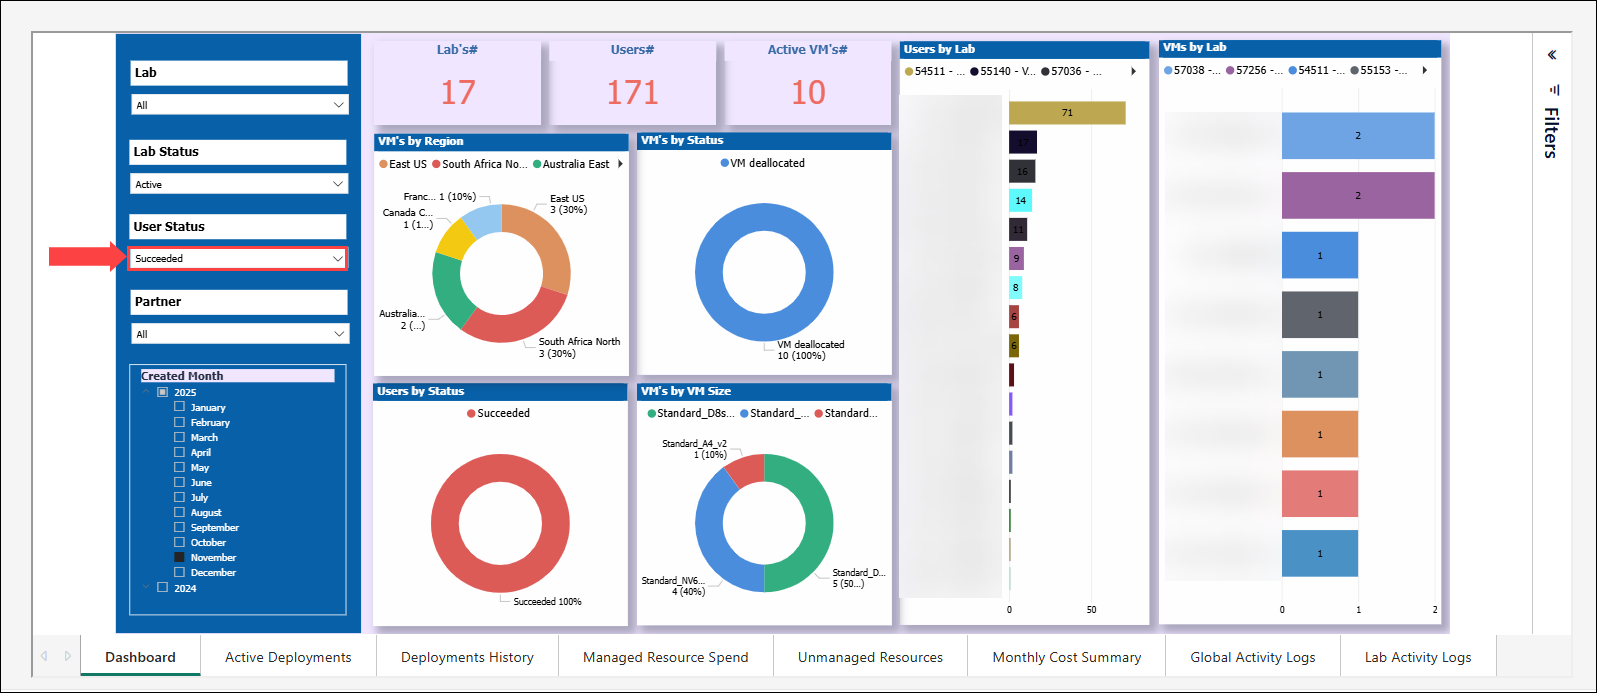
The filters on the left side of the report allow you to customize the data displayed based on Lab, User Status, and Month. This helps in obtaining more specific and relevant insights as per your requirements. Use the visualizations provided to understand trends, identify high-cost labs, track user activity, and monitor the state of VMs. This enables better decision-making and efficient lab management. Below are some examples of altering the report using filters:
Filter by Lab: Select a specific lab from the Lab dropdown to view data for that lab only. For example, selecting CLoudLabs-Demo-Lab will show details related to that lab.
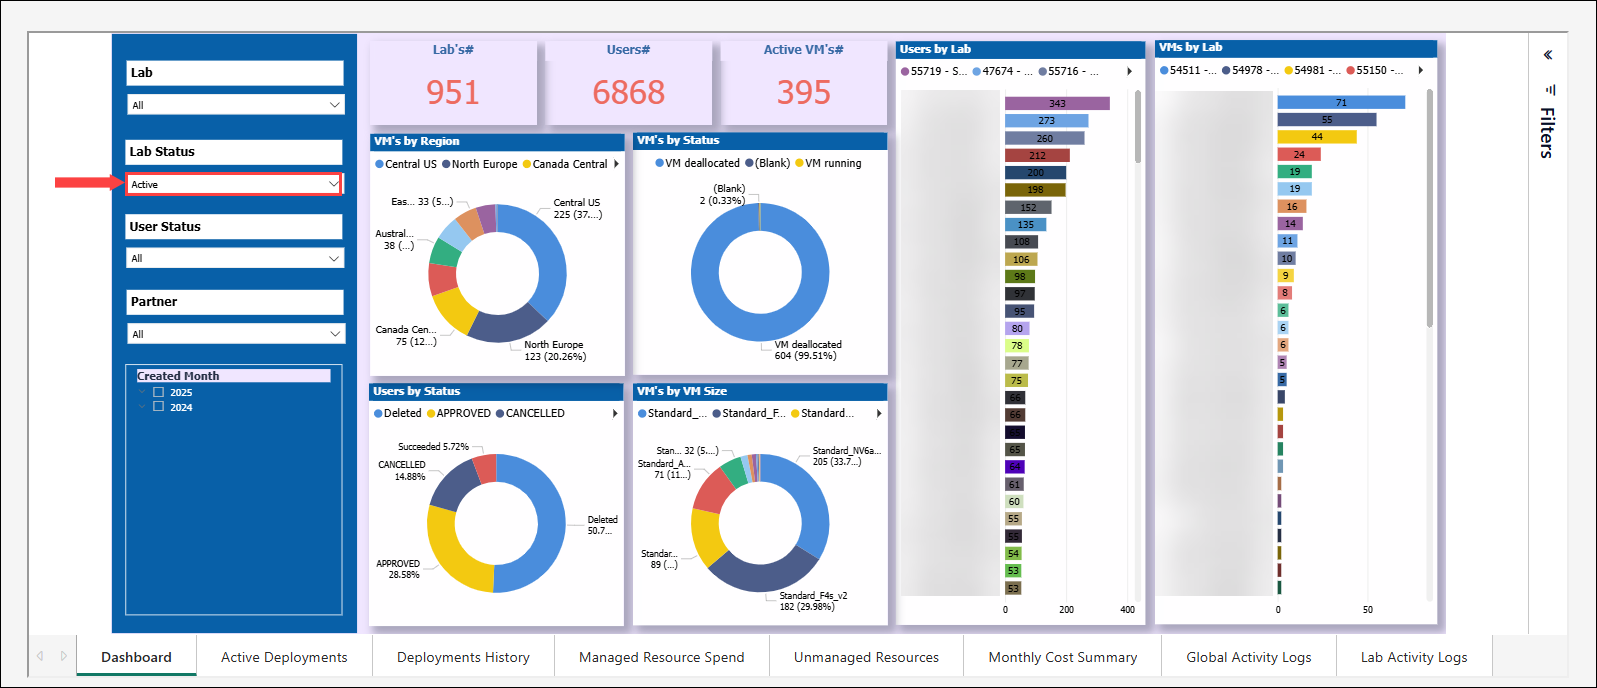
Filter by Lab Status: This option allows you to view details based on their status, either "Active" or "Decommissioned," using a dropdown menu. The chart will then display relevant details based on the selected lab status, providing meaning full insights.
Filter by Month: The Created Month filter allows you to narrow down data based on the creation date of labs. It is organized by year and month for easy navigation and selection.
Filter by User Status: Use the User Status dropdown to filter users based on their status. For instance, selecting Succeeded will display data for all the users whose VM’s are active.
Active Deployments
Provides a comprehensive view of all lab deployments, including details like deployment status, VM status, lab creator, user information, resource usage, and others. Useful for monitoring lab activity, analyzing trends, and managing resource allocation.
Navigate to the Active Deployments section by selecting the Active Deployments tab located at the bottom of the dashboard.
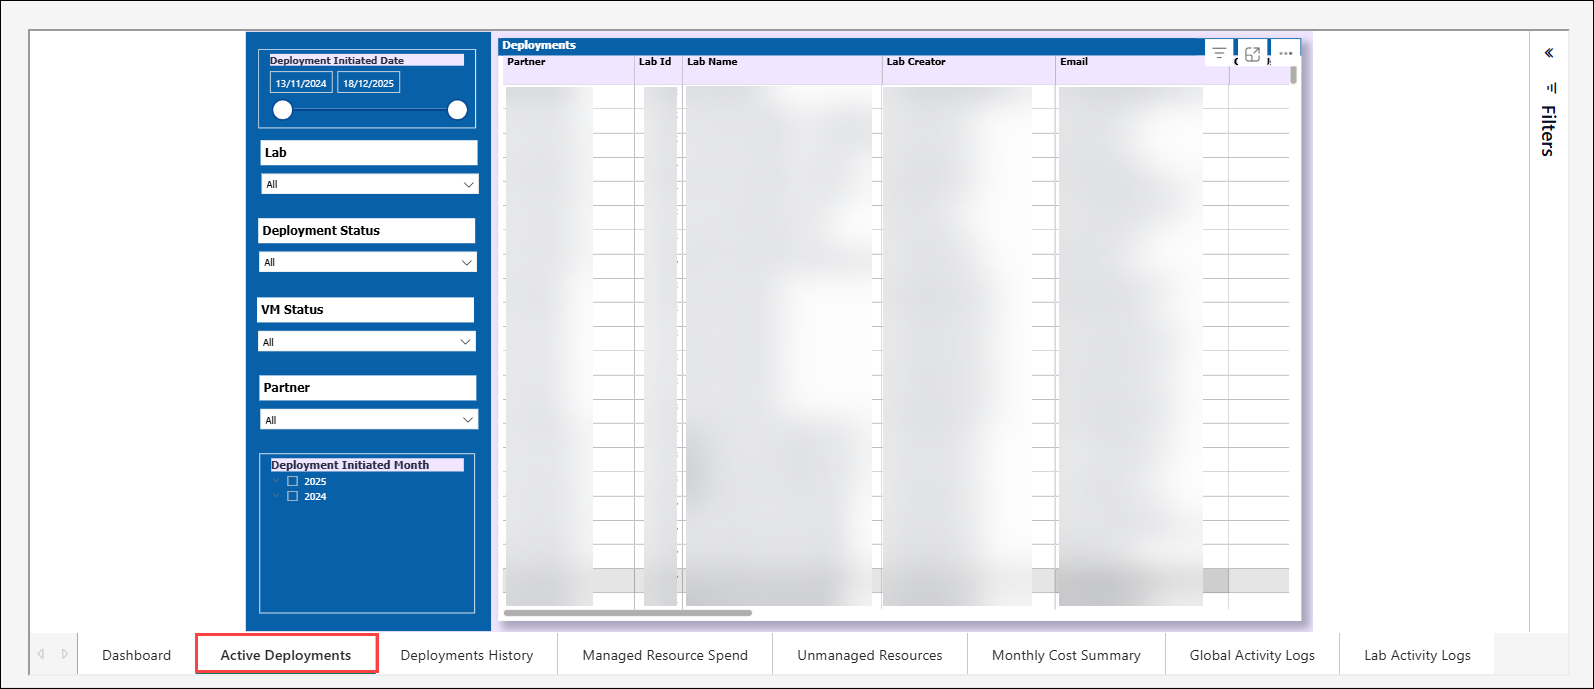
This section offers detailed insights into all lab deployments, including the following key attributes:
Lab ID & Name
Lab Creator
Email
CloudUser ID
Created Time & Deletion Time
Deployment Status
VM SKU Name
VM Disk SKU Name
Disk Storage Type & Size
Lab VM Quota Consumed & Max VM Quota
Last Shutdown and Start time
VM Idle Tracker Installation Status
VM Continuous run and idle time
Altering Reports with Filters
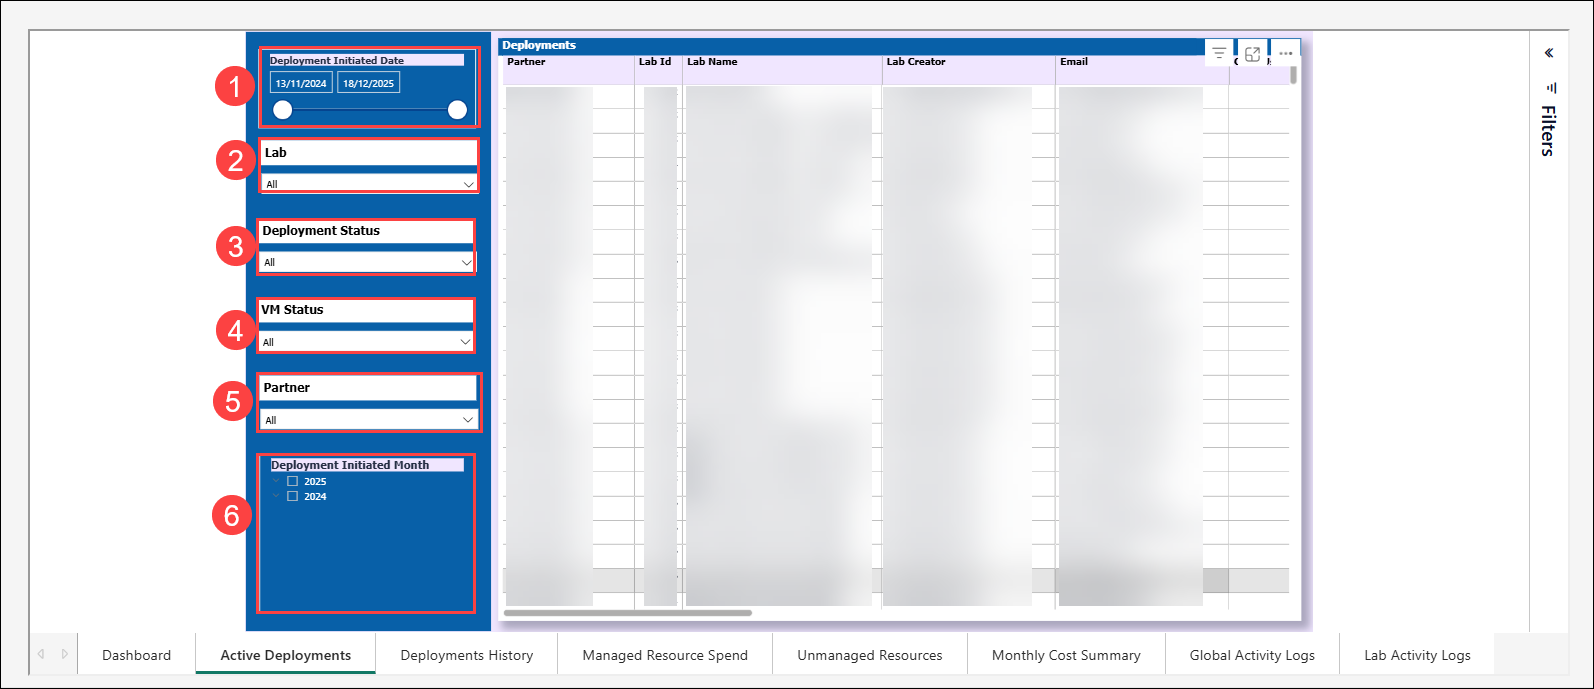
You can refine the deployment data using various filters available on the left panel:
Deployment Initiated Date (1) – Date range slider to filter deployments between specific start and end dates.
Lab (2) – Filter deployments based on specific lab name.
Deployment Status (3) – View deployments by status (e.g., Succeeded, Deleted).
VM Status (4) – Filter based on the current state of the virtual machines.
Partner (5) – Filter by the CloudLabs tenant name(s).
Deployment Initiated Month (6) – Select one or multiple months to analyze trends and usage over specific time periods.
These filters allow you to drill down into specific timeframes or deployment types, providing valuable insights into resource utilization and lab performance metrics.
Deployments History
The Deployments History section presents a comprehensive record of previously deployed environments, offering the flexibility to review and analyze historical deployments with clarity and precision. It provides detailed insights including the lab name, lab creator, VM SKU, disk type and size, as well as creation and deletion timestamps.
Additionally, advanced filtering options allow users to customize the report for a specific time range, enabling focused observation and meaningful analysis. This structured visibility supports informed decision making and contributes to efficient and effective lab management.
Navigate to the Deployments History section by selecting the Deployments History tab located at the bottom.
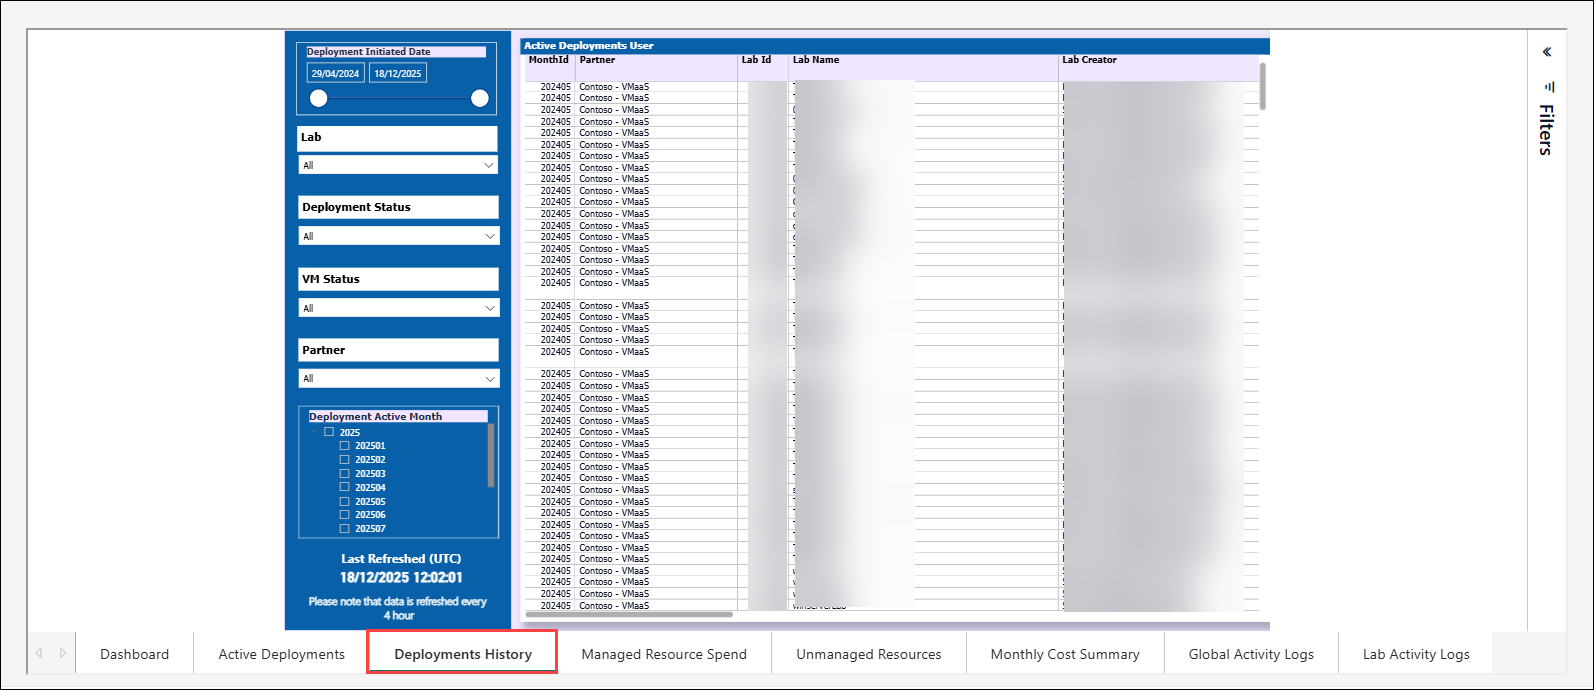
This section presents detailed information on all previous lab deployments, including the key attributes listed below:
Lab ID, Name & Creator
Email
CloudUserID
Created and End time
Deployment Status
VM SKU
Disk Type & Size
Lab VM Quota Consumed and Max Quota
VM Idle tracker Installation Status
VM Continuous and Idle time
Altering Reports With Filter
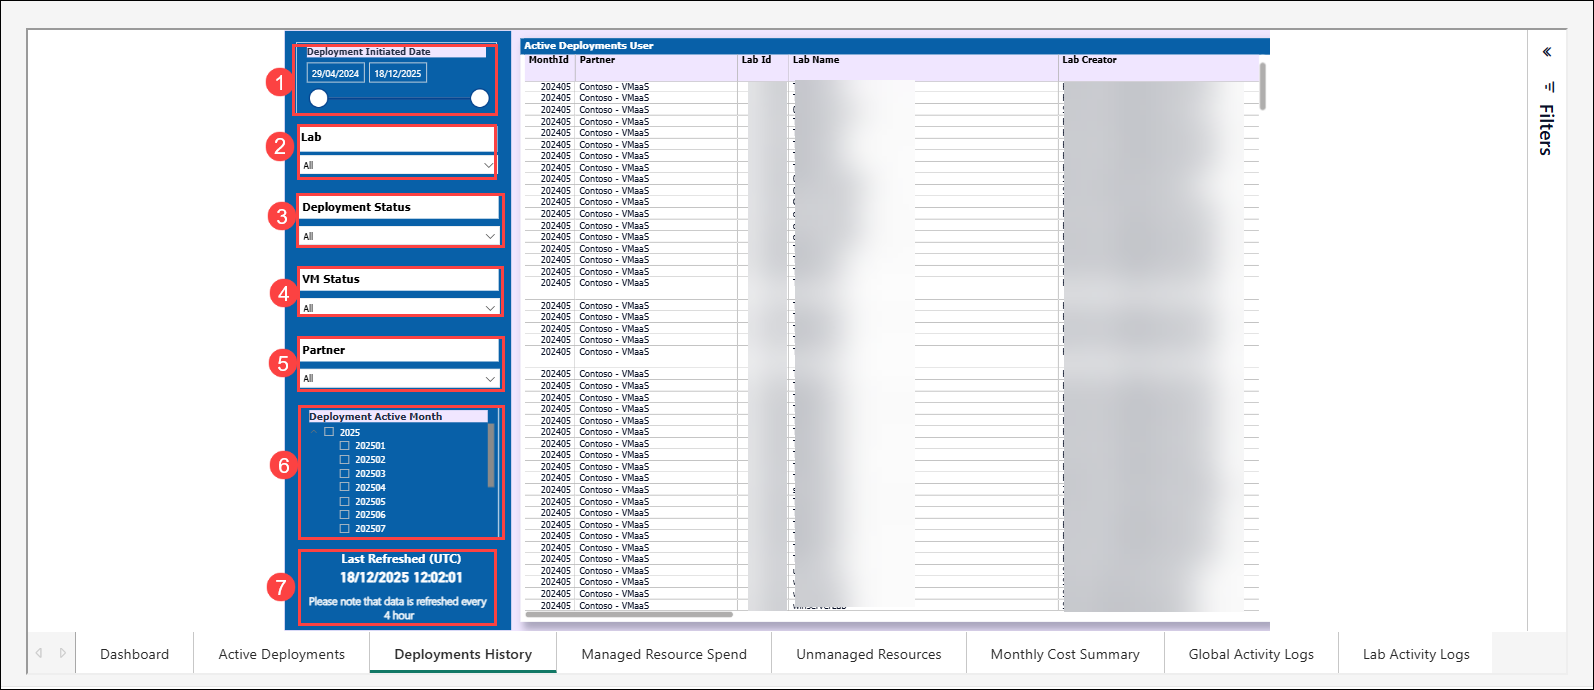
You can refine the deployment data using various filters available on the left panel:
Deployment Initiated Date (1) – Date range slider to filter deployments between specific start and end dates.
Lab (2) – Filter deployments based on specific lab name.
Deployment Status (3) – View deployments by status (e.g., Succeeded, Deleted).
VM Status (4) – Filter based on the current state of the virtual machines.
Partner (5) – Filter by the CloudLabs tenant name(s).
Deployment Active Month (6) – Select one or multiple months to analyze trends and usage over specific time periods.
Additional Information (7) –
Last Refreshed (UTC): Shows the last timestamp when the data was refreshed.
Data Refresh Cycle: Spend data is refreshed every 4 hours, ensuring up-to-date cost tracking.
These filters enable you to focus on specific timeframes or deployment types, offering clear insights into resource utilization and overall lab activity.
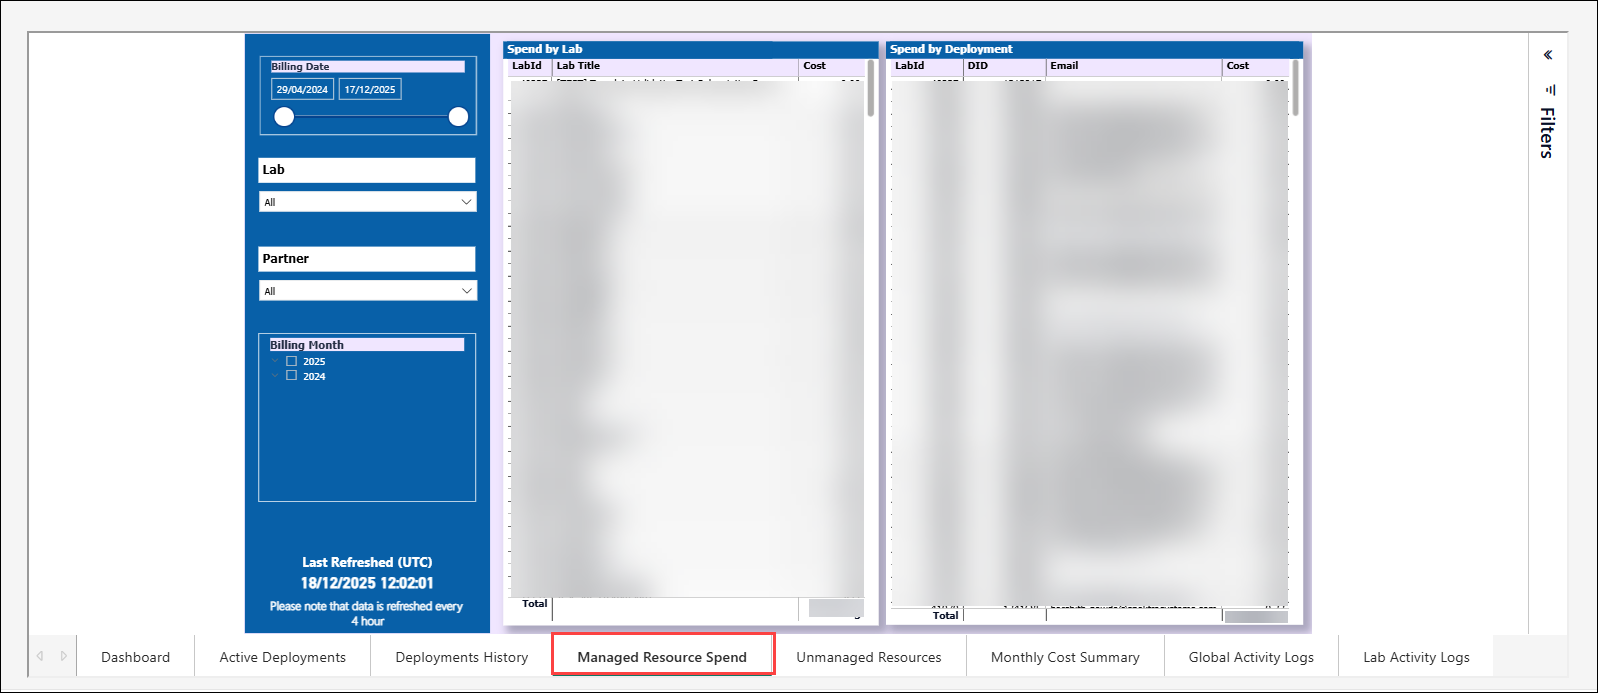
Managed Resource Spend
Displays detailed cost information for each lab and deployment, helping you track and manage spending. Ideal for analyzing usage patterns, controlling budgets, and identifying high-cost resources across labs and users.
Navigate to the Managed Resource Spend tab to view detailed insights into the costs incurred across various labs and individual deployments.
Altering Reports with Filters
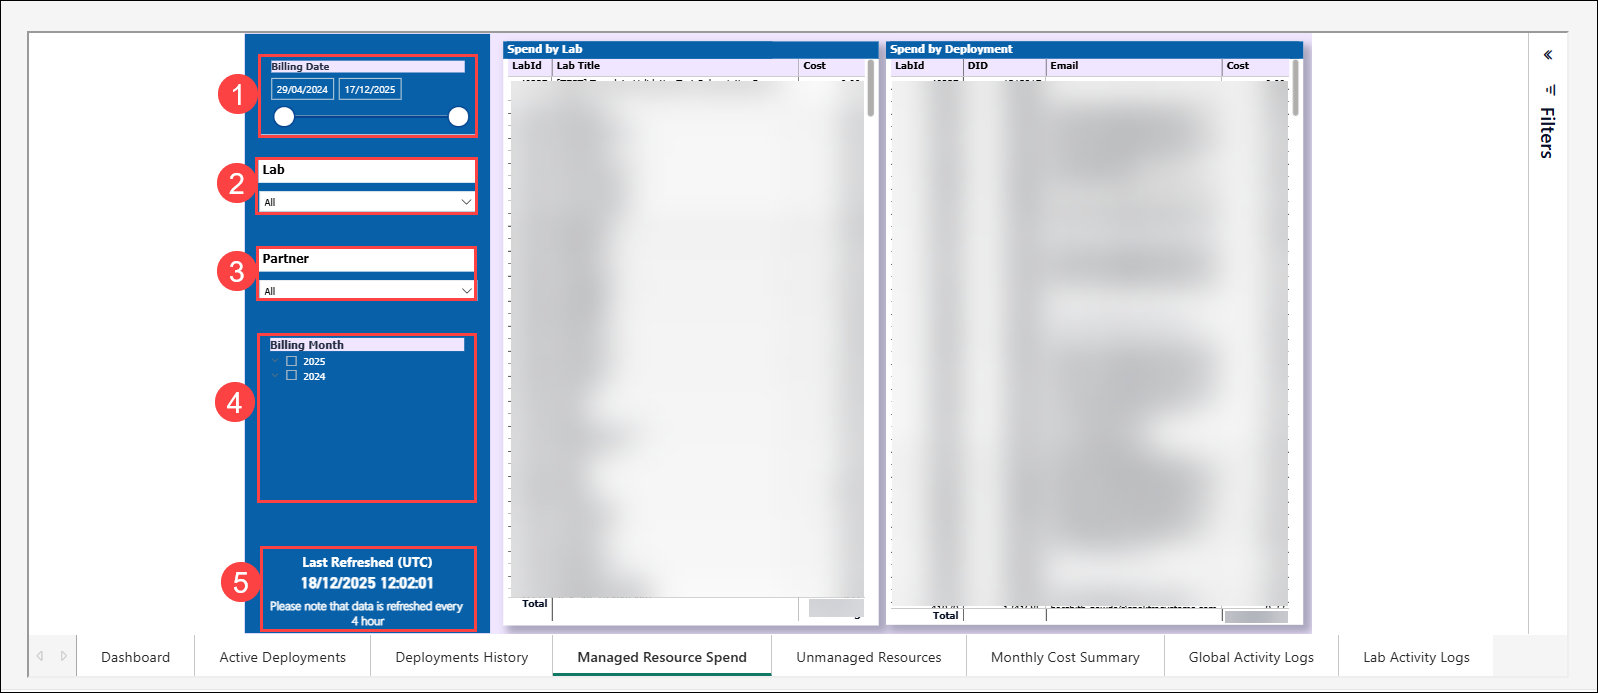
Billing Date (1) – Set a custom date range to view resource spend within specific billing cycles. This helps in tracking costs across any time span.
Lab (2) – Filter the cost breakdown based on a specific lab name to analyze cloud cost spent at a lab level.
Partner (3) – Filter by the CloudLabs tenant name(s).
Billing Month (4) – Choose one or multiple months across current or previous years to view month-wise spending trends.
Additional Information (5) –
Last Refreshed (UTC): Shows the last timestamp when the data was refreshed.
Data Refresh Cycle: Spend data is refreshed every 4 hours, ensuring up-to-date cost tracking.
Unmanaged Resources
This section displays Azure resources that are generating costs but are not associated with any active lab deployments. These typically include additional components such as Azure Compute Gallery images, VPNs, etc., that were provisioned but not tagged or mapped to a user deployment.
To access this section, navigate to the Unmanaged Resources tab in the reporting dashboard.
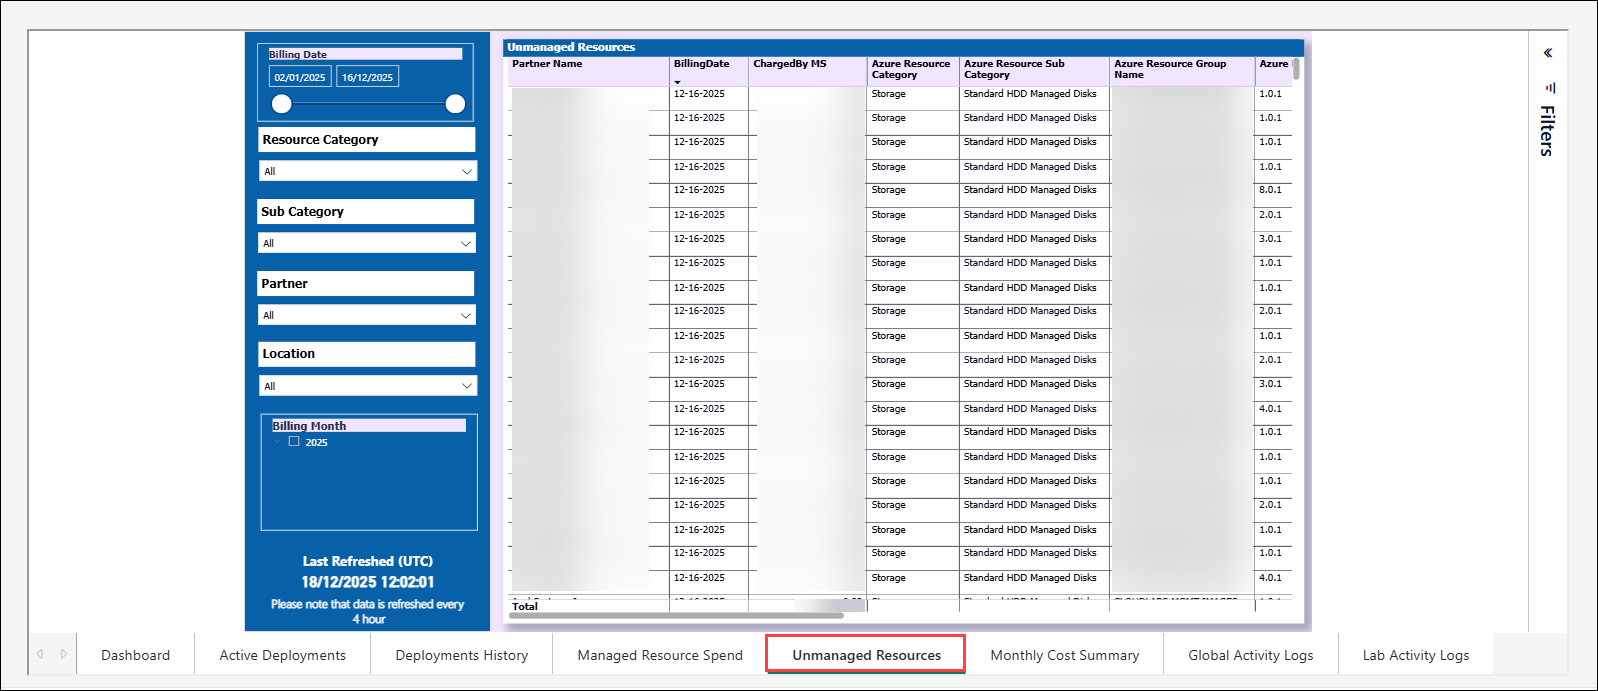
Partner Name – Indicates the CloudLabs tenant or partner associated with the unmanaged resource.
Billing Date – The date when the resource was billed.
ChargedBy MS – Cost incurred for the resource as billed by Microsoft Azure.
Azure Resource Category – Broad classification of the resource (e.g., Storage, Compute).
Azure Resource Sub Category – More specific type of the resource (e.g., Standard HDD Managed Disks).
Azure Resource Group Name – The Azure resource group under which the resource is provisioned.
Azure Resource Name – Unique name of the Azure resource being billed.
Resource URL – Direct link to the resource in the Azure portal.
Region – The Azure region where the resource is deployed.
Altering Reports with Filters
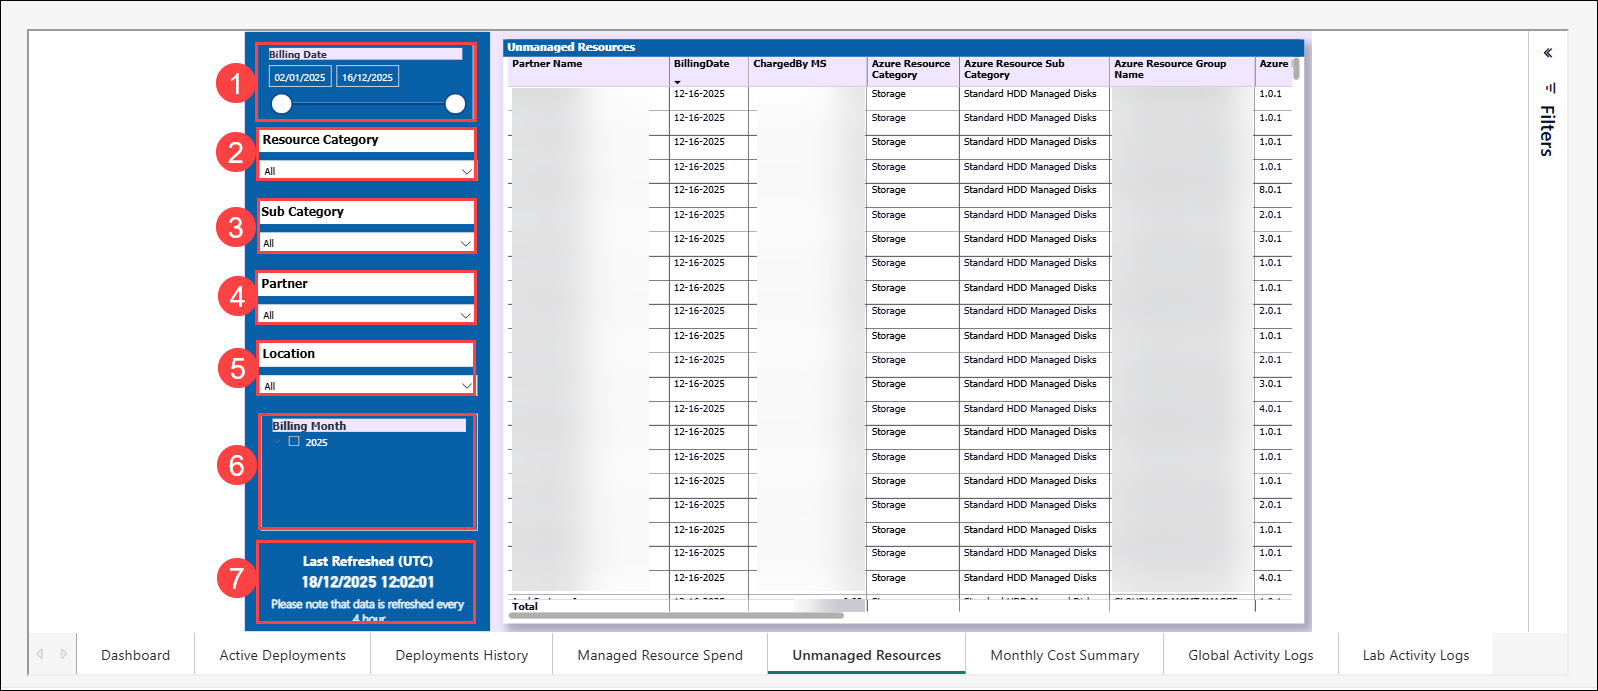
Billing Date (1) – Select a custom date range to view unmanaged resources billed within specific cycles.
Resource Category (2) – Filter by high-level categories like Storage, Compute, etc.
Sub Category (3) – Filter down further by specifying sub-categories under each resource type.
Partner (4) – Filter by the CloudLabs tenant name(s).
Location (5) – Filter by Azure deployment region (e.g., East US, West Europe).
Billing Month (6) – Choose one or more months to track resource usage and cost month-wise.
Additional Information (7) –
Last Refreshed (UTC): Shows the last timestamp when the data was refreshed.
Data Refresh Cycle: Spend data is refreshed every 4 hours, ensuring up-to-date cost tracking.
Monthly Cost Summary
The Monthly Cost Summary section allows you to view a detailed breakdown of cloud costs on a month-by-month basis. You can apply filters to analyze the cost consumed for each individual month, enabling you to track usage trends over time. For example, filtering by December 2025 will display the cost breakdown associated with each lab during that month, along with the total cost incurred across all labs.
This feature supports more accurate budget forecasting and helps in identifying periods of higher or lower cloud resource consumption, ultimately aiding in effective cost control and planning.
To view this report, navigate to the Monthly Cost Summary tab on the reporting dashboard.
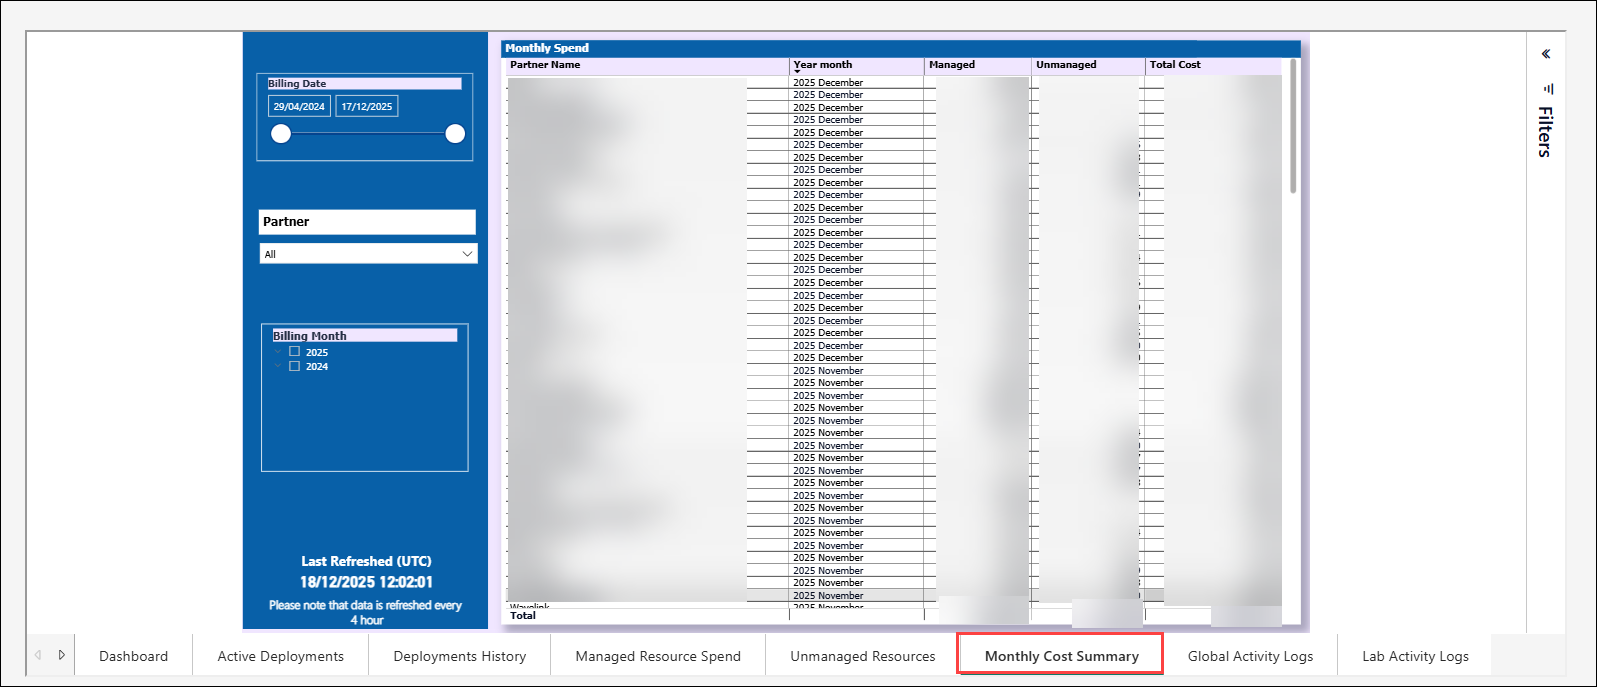
Partner Name - Indicates the CloudLabs tenant or partner associated with the unmanaged resource.
Year Month - Displays the month corresponding to that year.
Managed - Displays the total cost incurred for managed resources.
Unmanaged - Displays the total cost incurred for unmanaged resources.
Total Cost - Represents the total cost covering all managed and unmanaged resources.
Altering Reports with Filters
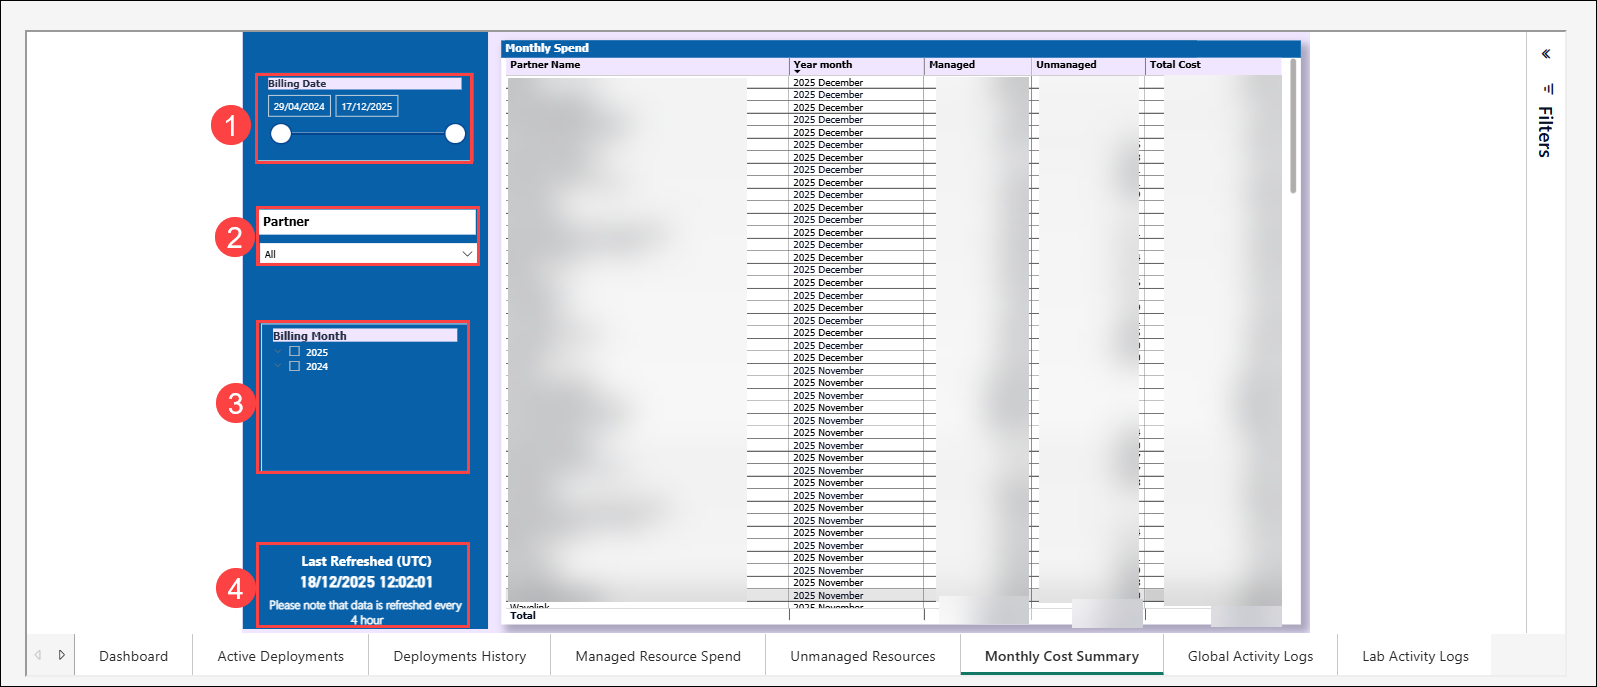
Billing Date (1) - Select a custom date range to view unmanaged resources billed within specific cycles.
Partner (2) - Filter by the CloudLabs tenant name(s).
Billing Month (3) - Choose one or more months to track resource usage and cost month-wise.
Additional Information (4) –
Last Refreshed (UTC): Shows the last timestamp when the data was refreshed.
Data Refresh Cycle: Spend data is refreshed every 4 hours, ensuring up-to-date cost tracking.
Global Activity Logs
The Global Activity Logs section provides a comprehensive view of all activities performed across the platform at a global level. It captures detailed information for each event, including the type of action performed, the user who initiated the event, and the exact date and time of occurrence.
This section enables administrators and stakeholders to gain clear visibility into system wide activities, helping them understand user actions, tracking changes, and monitor overall usage. By offering a consolidated and chronological record of events, the Global Activity Logs support effective auditing, analysis, and informed decision making.
To access this section, navigate to the Global Activity Logs tab in the reporting dashboard.
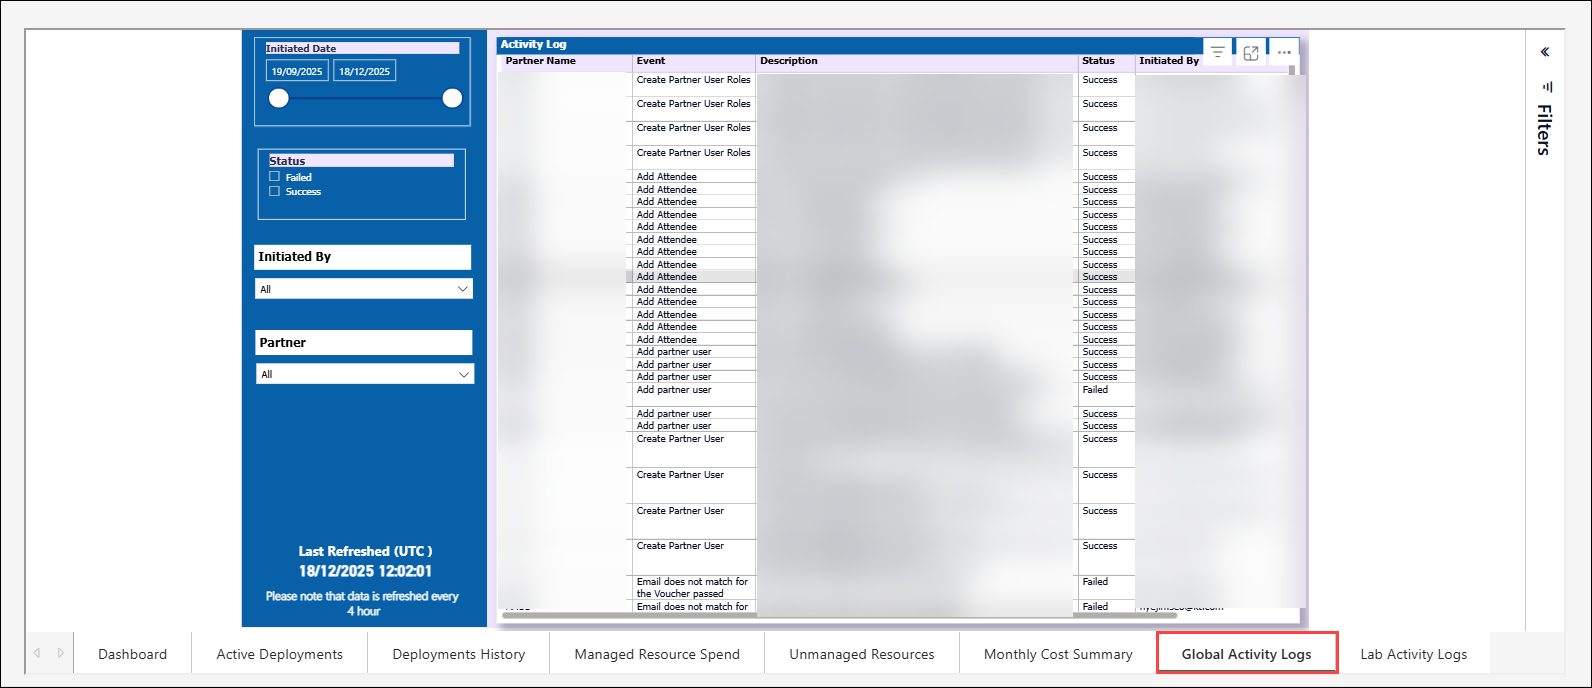
Partner Name - Indicates the CloudLabs tenant or partner associated with the Global Activity Logs.
Event - Indicates the type of action that was performed.
Description - This field provides additional information related to the event that was performed.
Status - Reflects the state of the event after execution.
Initiated By - Indicates the user responsible for initiating the event.
Altering Reports with Filters
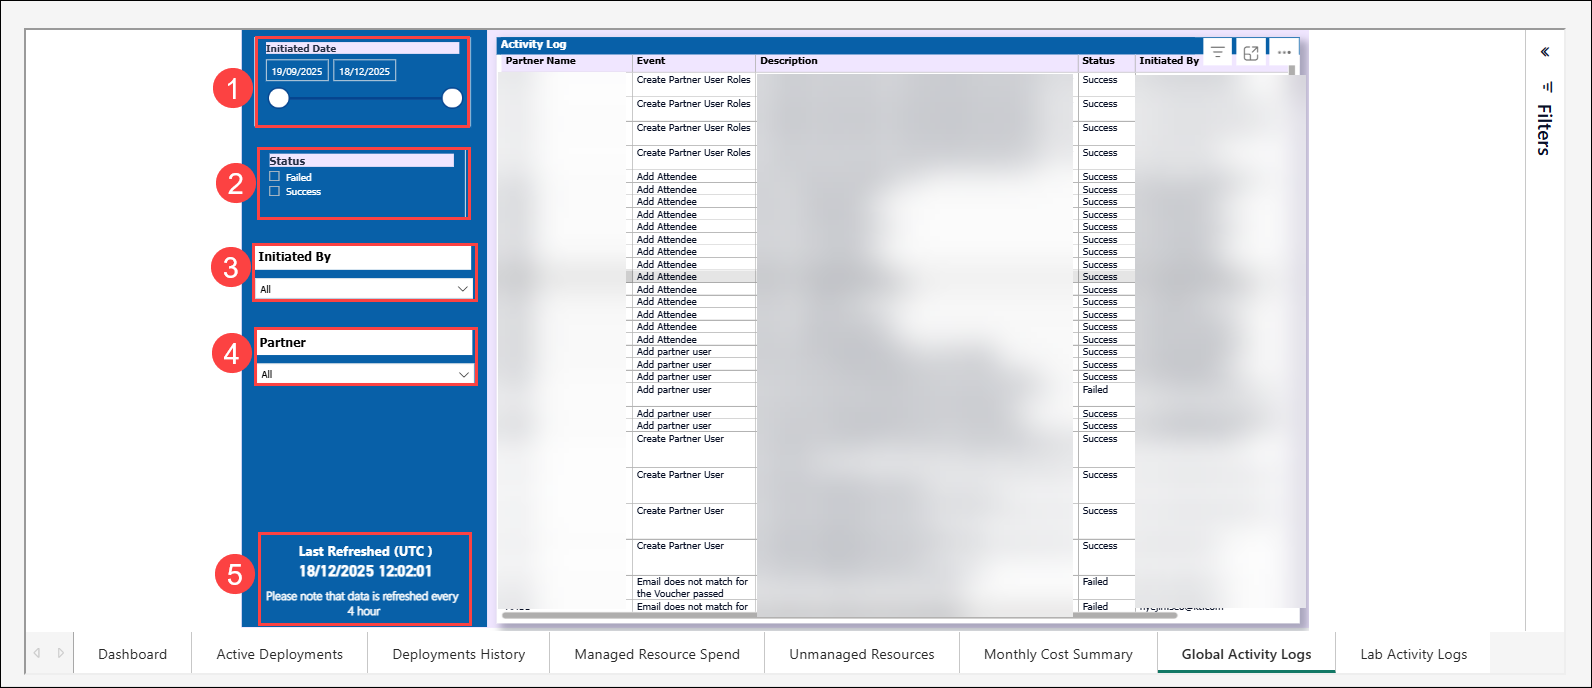
Initiated Date (1) - Date range slider to filter deployments between specific start and end dates.
Status (2) - Indicates whether the event was successful or failed.
Initiated By (3) - Indicates the user who initiated the event.
Partner (4) - Filter by the CloudLabs tenant name(s).
Additional Information (5) –
Last Refreshed (UTC): Shows the last timestamp when the data was refreshed.
Data Refresh Cycle: Spend data is refreshed every 4 hours, ensuring up-to-date cost tracking.
Lab Activity Logs
The Lab Activity Logs section provides detailed visibility into activities performed at the individual lab level. It captures a comprehensive record of events related to virtual machines, lab configurations, and lab users, along with precise timestamps for each action.
This section enables users and administrators to track who performed specific actions, what changes were made, and when those actions occurred. By offering structured, lab-wise activity records, the Lab Activity Logs support effective monitoring, auditing, and analysis of lab usage, helping ensure better control, accountability, and informed lab management.
Navigate to the Lab Activity Logs section to gain detailed, lab wise insights into lab activities.
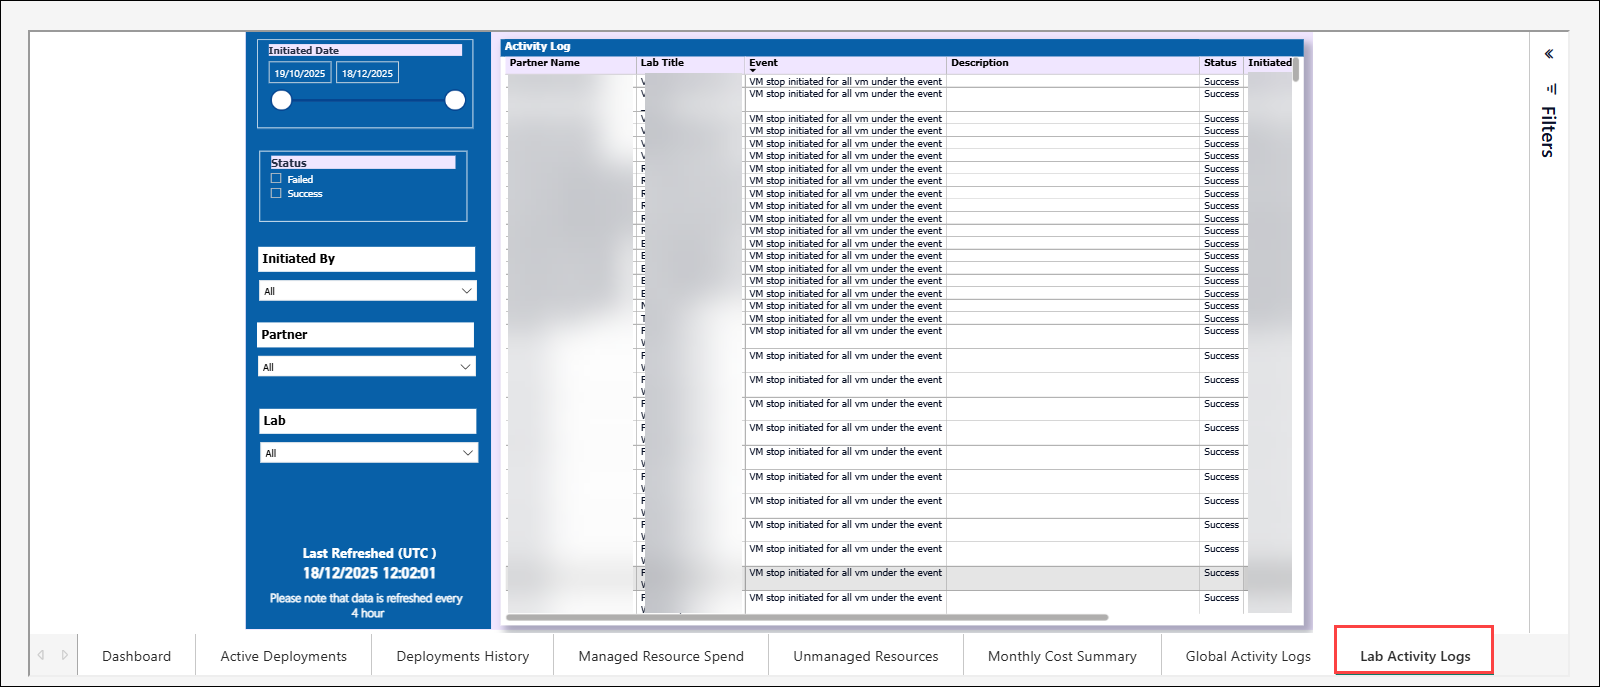
Partner Name - Indicates the CloudLabs tenant or partner associated with the Lab Activity Logs.
Lab Title - Displays the name of the lab associated with the activity.
Email - Displays the email address of the user related to the activity.
Description - Provides additional details describing the recorded activity.
Status - Indicates the outcome of the activity.
Initiated By - Identifies the user who initiated the activity.
Initiated Time - Records the date and time when the activity was initiated.
Altering Reports with Filters
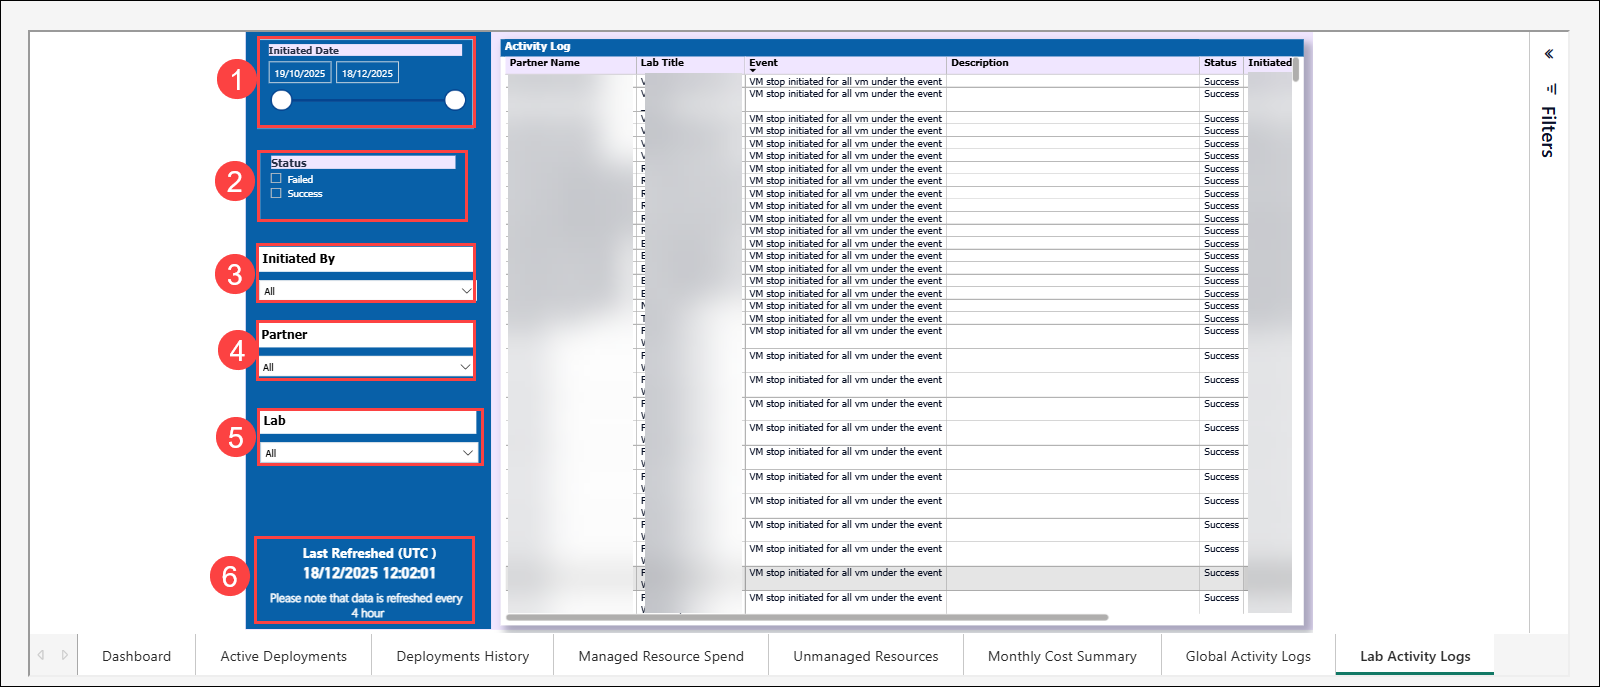
Initiated Date (1) - Date range slider to filter deployments between specific start and end dates.
Status (2) - Indicates the outcome of the activity.
Initiated By (3) - Indicates the user who initiated the event.
Partner (4) - Filter by the CloudLabs tenant name(s).
Lab (5) - Displays the lab to which the activity belongs.
Additional Information (6) –
Last Refreshed (UTC): Shows the last timestamp when the data was refreshed.
Data Refresh Cycle: Spend data is refreshed every 4 hours, ensuring up-to-date cost tracking.
Download Report
Open the report you would like to export and click on the More options (three dots) menu.
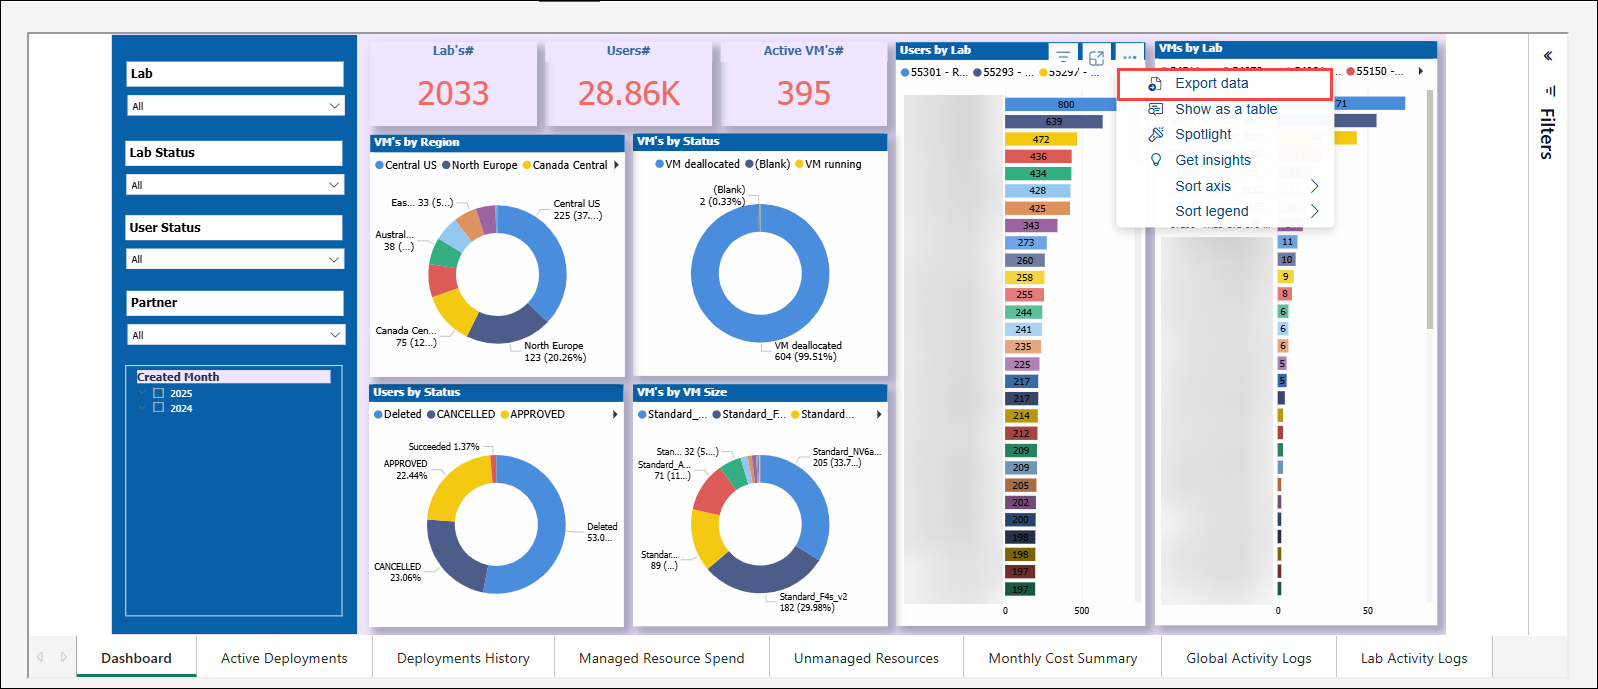
Click on Export data to export the data from Power BI.
Select the layout you prefer and choose the desired file format. Click on Export to download files in CSV and XLSX
formats.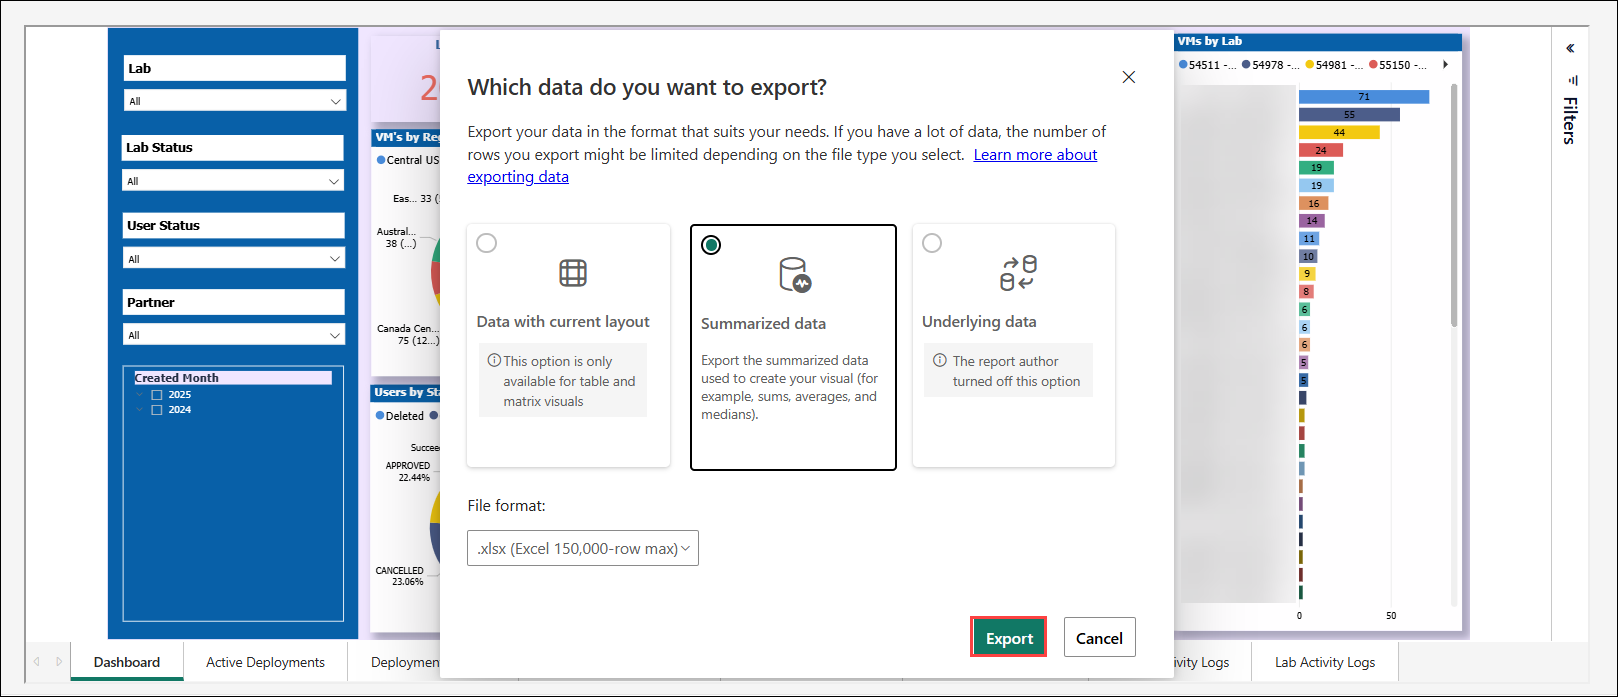
Next Steps
In this article, you have learned how to understand and read reports, as well as how to alter the report using filters to get insightful data.
You can now start utilizing these reports to monitor and optimize your labs effectively. For detailed steps on creating and managing labs, refer to the Create Labs article.